NCERT Solutions for Class 9 Maths Chapter 8 Linear Equations in Two Variables Ex 8.2

NCERT Solutions for Class 9 Maths Chapter 8 Linear Equations in Two Variables Ex 8.2 are part of NCERT Solutions for Class 9 Maths. Here we have given NCERT Solutions for Class 9 Maths Chapter 8 Linear Equations in Two Variables Ex 8.2.

BoardCBSE
TextbookNCERT
ClassClass 9
SubjectMaths
ChapterChapter 8
Chapter NameLinear Equations in Two Variables
ExerciseEx 8.2
Number of Questions Solved4
CategoryNCERT Solutions

NCERT Solutions for Class 9 Maths Chapter 8 Linear Equations in Two Variables Ex 8.2

Question 1.
Which one of the following options is true and why? y = 3x + 5 has
(i) a unique solution
(ii) only two solutions
(iii) infinitely many solutions
Solution:
(iii) A linear equation in two variables has infinitely many solutions.

Question 2.
Write four solutions for each of the following equations
(i) 2x + y = 7
(ii) πx + y = 9
(iii) x = 4y
Solution:
(i) 2x + y = 7
By inspection, x = 2 and y = 3 is a solution because for x = 2, y = 3,
2x + y = 2 x 2 + 3 = 4 + 3 = 7
Now, let us choose x = 0 with this value of x, the given equation reduces to y = 7.
So, x = 0, y = 7 is also a solution of 2x + y = 7. Similarly, taking y = 0,
the given equation reduces to 2x = 7 which has the unique solution x = \(\frac { 7 }{ 2 }\) .
So, x = \(\frac { 7 }{ 2 }\) , y = 0 is a solution of 2x + y = 7.
Finally, let us take x = 1
The given equation now reduces to 2 + y = 7 hose solution is given by y = 5.
Therefore, (1, 5) is also a solution of the given equation.
So, four of the infinitely many solutions of the given equation are (2, 3), (0, 7), ( \(\frac { 7 }{ 2 }\) , 0) and (1,5).

(ii) πx + y = 9
NCERT Solutions for Class 9 Maths Chapter 8 Linear Equations in Two Variables Ex 8.2 img 1
Now, let us choose x = 0 with this value of x,
the given equation reduces to y = 9 which has a unique solution y = 9.
So, x = 0, y = 9 is also a solution of πx + y = 9
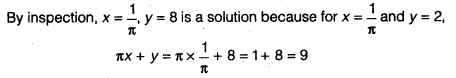
Similarly, taking y = 0, the given equation reduces to x = \(\frac { 9 }{ \pi }\) So, x = \(\frac { 9 }{ \pi }\) ,y = 0 is a solution of πx + y = 9as well.
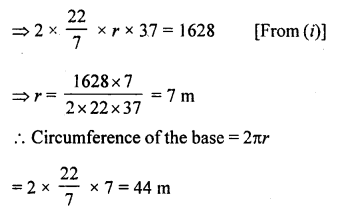
Finally, let us take x = 7 the given equation now reduces to \(\frac { 22 }{ 7 }\) . 7 + y = 9
whose solution is given by y = -13.
Therefore; (7,-13) is also a solution of the given equation.
So, four of the infinitely many solutions of the given equation are
NCERT Solutions for Class 9 Maths Chapter 8 Linear Equations in Two Variables Ex 8.2 img 2
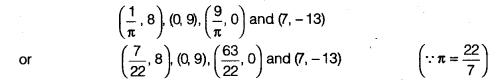
(iii) x = 4y ⇒ x – 4y = 0
By inspection, x = 0, y = 0 is a solution because for x = y = 0, 0 – 4 x 0 = 0 – 0 = 0, it satisfies.
Now, let us choose x = 4 with this value of x,
the given equation reduces to y = 1 which has a unique solution y = 1.
So, x = 4, y = 1 is also a solution , of x – 4y = 0. Similarly, taking y = \(\frac { 1 }{ 2 }\) , the given equation reduces to x = 2.
So , x = 2, y = \(\frac { 1 }{ 2 }\) is a solution x – 4y = 0 as well.
Finally, let us take x = 1, the given equation now reduces to 1 – 4y = 0
whose solution is given by y = \(\frac { 1 }{ 4 }\). Therefore, (1,1/4) is also a solution of the given equation. So, four
of the infinitely many solutions of the given equation are
NCERT Solutions for Class 9 Maths Chapter 8 Linear Equations in Two Variables Ex 8.2 img 3

Question 3.
Check which of the following are solution of the equation x – 2y = 4 and which are not?
(i) (0, 2)
(ii) (2,0)
(iii) (4,0)
(iv) (√2,4√2)
(v) (1,1)
Solution:
(i) Take x – 2y and put x = 0, y = 2,
we get 0 – 2 x 2 = 0 – 4 = -4 ≠ 4
Hence, (0, 2) is not a solution of x – 2y = 4.

(ii)
Take x – 2y and put x = 2, y = 0,
we get 2 – 2 x 0 = 2 – 0 = 2 ≠ 4
Hence, (2, 0) is not a solution of x – 2y = 4.

(iii)
Take x – 2y and put x = 4, y = 0;
we get 4 – 2 x 0 = 4 – 0 = 4
Hence, (4, 0) is a solution of x – 2y = 4.

(iv)
Take x – 2y and put x = √2, y = 4√2, we get
√2 – 2 x 4√2 = √2 – 8√2 =-7√2 ≠ 4
Hence, (√2,4√2) is not a solution of x – 2y = 4

(v)
Take x – 2y and put x = 1, y = 1,
we get 1 – 2 x 1 = 1 – 2 = -1 ≠ 4
Hence, (1,1) is not a solution of x – 2y = 4.

Question 4.
Find the value of k, if x = 2, y = 1 is a solution of the equation 2x + 3 y = k.
Solution:
Take 2x + 3y = k
Put x = 2, y = 1 then we get, 2 x 2 + 3 x 1 = k
⇒ 4 + 3 = k
⇒ k = 7
We hope the NCERT Solutions for Class 9 Maths Chapter 8 Linear Equations in Two Variables Ex 8.2 help you. If you have any query regarding NCERT Solutions for Class 9 Maths Chapter 8 Linear Equations in Two Variables Ex 8.2, drop a comment below and we will get back to you at the earliest.

RD Sharma Class 8 Solutions Chapter 22 Mensuration III Ex 22.1

RD Sharma Class 8 Solutions Chapter 22 Mensuration III (Surface Area and Volume of a Right Circular Cylinder) Ex 22.1

These Solutions are part of RD Sharma Class 8 Solutions. Here we have given RD Sharma Class 8 Solutions Chapter 22 Mensuration III Ex 22.1

Other Exercises

Question 1.
Find the curved surface area and total surface area of a cylinder, the diameter of whose base is 7 cm and height is 60 cm.
Solution:
Diameter of the base of cylinder = 7 cm
∴ Radius (r) = \(\frac { 7 }{ 2 }\) cm
Height (h) = 60m
∴ carved surface area = 2πh
= 2 x \(\frac { 22 }{ 7 }\) x \(\frac { 7 }{ 2 }\) x 60cm2 = 1320cm2
RD Sharma Class 8 Solutions Chapter 22 Mensuration III Ex 22.1 1
RD Sharma Class 8 Solutions Chapter 22 Mensuration III Ex 22.1 2

Question 2.
The curved surface area of a cylindrical road is 132 cm2. Find its length if the radius is 0.35 cm.
Solution:
Curved surface area =132 cm2
Radius (r) = 0.35 cm
Let h be the length of the rod Then 2πrh = 132
RD Sharma Class 8 Solutions Chapter 22 Mensuration III Ex 22.1 3

Question 3.
The area of the base of a right circular cylinder is 616 cm2 and its height is 2.5 cm. Find the curved surface area of the cylinder.
Solution:
Let r be the radius of the base of the cylinder, then
Area of the base = πr2
RD Sharma Class 8 Solutions Chapter 22 Mensuration III Ex 22.1 4

Question 4.
The circumference of the base of a cylinder is 88 cm and its height is 15 cm. Find its curved surface area and total surface area.
Solution:
Height of the cylinder (h) = 15 cm
Circumference of the base = 88 cm
Let r be the radius of the base, the circumference = 2πr
∴ 2πr = 88 cm …(i)
RD Sharma Class 8 Solutions Chapter 22 Mensuration III Ex 22.1 5

Question 5.
A rectangular strip 25 cm x 7 cm is rotated about the longer side. Find the total surface area of the solid thus generated.
Solution:
Dimensions of rectangular strip = 25 cm x 7 cm
By rotating the strip along longer side, a solid is formed whose radius = 7 cm
and height = 25 cm
RD Sharma Class 8 Solutions Chapter 22 Mensuration III Ex 22.1 6
RD Sharma Class 8 Solutions Chapter 22 Mensuration III Ex 22.1 7

Question 6.
A rectangular sheet of paper 44 cm x 20 cm, is rolled along its length to form a cylinder. Find the the total surface area of the cylinder thus generated.
Solution:
By rolling along length wire, we get a cylinder whose circumference of its base = 20 cm
RD Sharma Class 8 Solutions Chapter 22 Mensuration III Ex 22.1 8

Question 7.
The radii of two cylinders are in the ratio of 2 : 3 and their heights are in the ratio 5 : 3. Calculate the ratio of their curved surface areas.
Solution:
Ratio in radii of two cylinders = 2:3
and ratio in their heights = 5:3
RD Sharma Class 8 Solutions Chapter 22 Mensuration III Ex 22.1 9

Question 8.
The ratio between the curved surface area and the total surface area of a right circular cylinder is 1: 2. Prove that its height and radius are equal.
Solution:
Let r be the radius and h be the height of a right circular cylinder, then Curved surface area = 2πrh
and total surface area = 2πrh x 2πr2 = 2πr (h + r)
But their ratio is 1 : 2
RD Sharma Class 8 Solutions Chapter 22 Mensuration III Ex 22.1 10
Hence their radius and height are equal.

Question 9.
The curved surface area of a cylinder is 1320 cm2 and its base has diameter 21 cm. Find the height of the cylinder.
Solution:
Curved surface area of a cylinder = 1320 cm2
Diameter of its base (d) = 21 cm 21
Radius (r) = \(\frac { 21 }{ 2 }\) cm
Let h be the height of the cylinder
RD Sharma Class 8 Solutions Chapter 22 Mensuration III Ex 22.1 11

Question 10.
The height of a right circular, cylinder is 10.5 m. If three times the sum of the areas of its two circular faces is twice the area of the curved surface area. Find the radius of its base.
Solution:
Height of cylinder = 10.5 m
Let r be the radius and h be the height of a right circular cylinder, then Area of its two circular faces = 2π2
and area of curved surface = 2πrh
Now, according to the condition:
RD Sharma Class 8 Solutions Chapter 22 Mensuration III Ex 22.1 12

Question 11.
Find the cost of plastering the inner surface of a well at Rs 9.50 per m2, if it is 21 m deep and diameter of its top is 6 m.
Solution:
Diameter of the top of a cylindrical well = 6m
RD Sharma Class 8 Solutions Chapter 22 Mensuration III Ex 22.1 13
∴ Radius (r) = \(\frac { 6 }{ 2 }\) = 3 m
and depth (h) = 21 m
∴ Curved surface area = 2πrh = 2 x \(\frac { 22 }{ 7 }\) x 3 x 21 m2 = 396 m2
Rate of plastering = Rs 9.50 per m2
∴ Total cost of plastering = Rs 9.50 x 396 = Rs 3,762

Question 12.
A cylindrical vessel open at the top has diameter 20 cm and height 14 cm. Find the cost of the tin-plating it on the inside at the rate of 50 paise per hundred square centimetre.
Solution:
Diameter of the vessel = 20 cm
RD Sharma Class 8 Solutions Chapter 22 Mensuration III Ex 22.1 14
RD Sharma Class 8 Solutions Chapter 22 Mensuration III Ex 22.1 15

Question 13.
The inner diameter of a circular well is 3.5 m. It is 10 m deep. Find the cost of plastering its inner curved surface at Rs 4 per square metre.
Solution:
Diameter of the well = 3.5 m
RD Sharma Class 8 Solutions Chapter 22 Mensuration III Ex 22.1 16

Question 14.
The diameter of a roller is 84 cm and its length is T20 cm. It takes 500 complete revolutions moving once over to level a playground. What is the area of the playground ?
Solution:
Diameter of the roller = 84 cm
RD Sharma Class 8 Solutions Chapter 22 Mensuration III Ex 22.1 17

Question 15.
Twenty cylindrical pillars of the Parliament House are to be cleaned. If the diameter of each pillar is 0.50 m and height is 4 m, what will be the cost of cleaning them at the rate of Rs 2.50 per square metre ?
Solution:
Diameter of each pillar = 0.50 m
RD Sharma Class 8 Solutions Chapter 22 Mensuration III Ex 22.1 18

Question 16.
The total surface area of a hollow cylinder which is open from both sides is 4620 sq. cm, area of the base ring is 115.5 sq. cm and height 7 cm. Find the thickness of the cylinder.
Solution:
Total surface area of a hollow cylinder opened from both sides = 4620 cm2
Area of base ring = 115.5 cm2
Height of cylinder (h) = 7 cm
Let R be the outer radius and r be the inner radius
RD Sharma Class 8 Solutions Chapter 22 Mensuration III Ex 22.1 19
RD Sharma Class 8 Solutions Chapter 22 Mensuration III Ex 22.1 20

Question 17.
The sum of the radius of the base and height of a solid cylinder is 37 m, if the total surface area of the solid cylinder is 1628 m2, find the circumference of its base.
Solution:
Let r be the radius and h be the height of the solid cylinder, then r + h = 37 m …(i)
Total surface area = 1628
⇒ 2πr (r + h) = 1628
RD Sharma Class 8 Solutions Chapter 22 Mensuration III Ex 22.1 21

Question 18.
Find the ratio between the total surface area of a cylinder to is curved surface area,given that its height and radius are 7.5 cm and 3.5 cm.
Solution:
Radius (r) of cylinder = 3.5 cm
and height (h) = 7.5 cm
∴ Curved surface area = 2πrh
and total surface area = 2πr (h + r)
∴ Ratio = 2πr (h + r)- 2πrh = (h + r): h = 7.5 + 3.5 : 7.5
⇒ 11 : 7.5
RD Sharma Class 8 Solutions Chapter 22 Mensuration III Ex 22.1 22

Question 19.
A cylindrical vessel, without lid, has to be tin-coated on its both sides. If the radius of the base is 70 cm and its height is 1.4 m, calculate the cost of tin-coating at the rate of Rs 3.50 per 1000 cm2.
Solution:
Radius of the vessel (r) = 70 cm
and height (h) = 1.4 m = 140 cm
∴ Area of inner and outer curved surfaces and bases = 2 x 2πrh + 2πr2
RD Sharma Class 8 Solutions Chapter 22 Mensuration III Ex 22.1 23


Hope given RD Sharma Class 8 Solutions Chapter 22 Mensuration III Ex 22.1 are helpful to complete your math homework.

If you have any doubts, please comment below. Learn Insta try to provide online math tutoring for you.

RD Sharma Class 8 Solutions Chapter 23 Data Handling I Ex 23.2

RD Sharma Class 8 Solutions Chapter 23 Data Handling I Ex 23.2

These Solutions are part of RD Sharma Class 8 Solutions. Here we have given RD Sharma Class 8 Solutions Chapter 23 Data Handling I Ex 23.2

Other Exercises

Question 1.
The marks obtained by 40 students of class VIII in an examination are given below :
16, 17, 18, 3, 7, 23, 18, 13, 10, 21, 7, 1, 13,
21, 13, 15, 19, 24, 16, 3, 23, 5, 12, 18, 8, 12, 6,
8, 16, 5, 3, 5, 0, 7, 9, 12, 20, 10, 2, 23.
Divide the data into five groups, namely 0-5,5-10,10-15,15-20 and 20-25 and prepare a grouped frequency table.
Solution:
Frequency distribution table
RD Sharma Class 8 Solutions Chapter 23 Data Handling I Ex 23.2 1

Question 2.
The marks scored by 20 students in a test are given below :
54, 42, 68, 56, 62, 71, 78, 51, 72, 53, 44, 58, 47, 64, 41, 57, 89, 53, 84, 57.
Complete the following frequency table :
RD Sharma Class 8 Solutions Chapter 23 Data Handling I Ex 23.2 2
What is the class interval in which the greatest frequency occurs ?
Solution:
RD Sharma Class 8 Solutions Chapter 23 Data Handling I Ex 23.2 3
The class in which the greatest frequency is 50-60

Question 3.
The following is the distribution of weights (in kg) of 52 persons :
RD Sharma Class 8 Solutions Chapter 23 Data Handling I Ex 23.2 4
RD Sharma Class 8 Solutions Chapter 23 Data Handling I Ex 23.2 5
(i) What is the lower limit of class 50-60 ?
(ii) Find the class marks of the classes 40-50, 50-60.
(iii) What is the class size ?
Solution:
(i) Lower limit of class 50-60 = 50
(ii) Class marks of 40-50 = \(\frac { 40+50 }{ 2 }\) = \(\frac { 90 }{ 2 }\)
= 45 and of 50-60 = \(\frac { 50+60 }{ 2 }\) = \(\frac { 110 }{ 2 }\) =55
(iii) Class size is 10

Question 4.
Construct a frequency table for the following weights (in gm) of 35 mangoes using the equal class intervals, one of them is 40-45 (45 not included):
30,40,45,32,43,50,55,62,70,70,61,62, 53,52, 50,42,35,37,53,55,65,70, 73, 74,45, 46, 58, 59, 60, 62, 74, 34, 35, 70 ,68.
(i) What is the class mark of the class interval 40-45 ?
(ii) What is the range of the above weights ?
(iii) How many classes are there ?
Solution:
Smallest observation = 30
Greatest observation = 74
Range = 74 – 30 = 44
Now forming the distribution table
RD Sharma Class 8 Solutions Chapter 23 Data Handling I Ex 23.2 6
(i) Class mark of 40-45
= \(\frac { 40+45 }{ 2 }\) = \(\frac { 85 }{ 2 }\) = 42.5
(ii) Range = 74 – 30 = 44
(iii) Number of classes are 9

Question 5.
Construct a frequency table with class-intervals 0-5 (5 not included) of the following marks obtained by a group of 30 students in an examination :
0, 5, 7,10, 12,15, 20, 22, 25, 27, 8, 11, 17,3, 6, 9,17,19, 21, 29, 31,35,37,40,42, 45, 49, 4, 50, 16.
Solution:
Frequency distribution table.
RD Sharma Class 8 Solutions Chapter 23 Data Handling I Ex 23.2 7

Question 6.
The marks scored by 40 students of class VIII in mathematics are given below:
81,55, 68, 79,85,43,29,68,54,73,47, 35, 72,64,95,44,50, 77,64,35,79, 52, 45,54,70,83, 62′, 64,72,92,84,76,63, 43, 54, 38, 73, 68, 52, 54.
Prepare a frequency distribution with class size of 10 marks.
Solution:
Largest marks = 95
Lowest marks = 29
Range = 95 – 29 = 66
Frequency distribution table
RD Sharma Class 8 Solutions Chapter 23 Data Handling I Ex 23.2 8

Question 7.
The heights (in cm) of 30 students of class VIII are given below :
155.158.154.158.160.148.149.150.153, 159,161,148,157,153,157,162,159,151, 154,156,152,156,160,152,147,155,163,155,157,153.
Prepare a frequency distribution table with 160-164 as one of the class intervals.
Solution:
Largest height =163
Lowest height =147
Range = 163- 147 = 16
RD Sharma Class 8 Solutions Chapter 23 Data Handling I Ex 23.2 9

Question 8.
The monthly wages of 30 workers in a factory are given below :
830,835,890,810,835,836,869,845,898, 890, 820, 860, 832, 833, 855, 845, 804, 808, 812, 840, 885, 835, 836, 878, 840, 868, 890, 806, 840, 890.
Represent the data in the form of a frequency distribution with class size 10.
Solution:
Highest wage = 898
Lowest wage = 804
Range = 898 – 804 = 94
Frequency distribution table
RD Sharma Class 8 Solutions Chapter 23 Data Handling I Ex 23.2 10

Question 9.
Construct a frequency table with equal class intervals from the following data on the monthly wages (in rupees) at 28 labourers working in a factory, taking one of the class intervals as 210-230 (230 not included):
220, 268, 258, 242, 210, 268, 272,242, 311, 290, 300, 320,319,304,302,318,306,292, 254, 278, 210,240, 280,316,306, 215, 256, 236.
Solution:
Highest wages = 320
Lowest wages = 210
Range = 320-210= 110
Frequency distribution table
RD Sharma Class 8 Solutions Chapter 23 Data Handling I Ex 23.2 11

Question 10.
The daily minimum temperatures in degrees Celsius recorded in a certain Arctic region are as follows :
-12.5, -10.8, -18.6, -8.4, -10.8, -4.2, -4.8, -6.7, -13.2, -11.8, -2.3,1.2, 2.6, 0, -2.4, 0, 3.2, 2.7,3.4,0, -2.4, -2.4, 0,3.2, 2.7,3.4, 0,2.4, -5.8, -8.9, -14.6, -12.3, -11.5, -7.8, – 2.9
Represent them as frequency distribution table taking -19.9 to -15 as the first class interval.
Solution:
Lowest temperature = -19.9
Highest temperature = 3.4
Frequency distribution table
RD Sharma Class 8 Solutions Chapter 23 Data Handling I Ex 23.2 12

Hope given RD Sharma Class 8 Solutions Chapter 23 Data Handling I Ex 23.2 are helpful to complete your math homework.

If you have any doubts, please comment below. Learn Insta try to provide online math tutoring for you.

RD Sharma Class 8 Solutions Chapter 23 Data Handling I Ex 23.1

RD Sharma Class 8 Solutions Chapter 23 Data Handling I (Classification and Tabulation of Data) Ex 23.1

These Solutions are part of RD Sharma Class 8 Solutions. Here we have given RD Sharma Class 8 Solutions Chapter 23 Data Handling I Ex 23.1

Other Exercises

Question 1.
Define the following terms :
(i) Observations
(ii) Raw data
(iii) Frequency of an observation
(iv) Frequency distribution
(v) Discrete frequency distribution
(vi) Grouped frequency distribution
(vii) Class-interval
(viii) Class-size
(ix) Class limits
(x) True class limits
Solution:
(i) Observations : Each entry in the given data is called an observation. ‘
(ii) Raw data: A collection of observations by an observer, is called raw data.
(iii) Frequency of an observation : The number of times an observation occurs in the given data is called its frequency.
(iv) Frequency distribution : The presentations of given data in order of magnitude ascending or descending, is called the frequency distribution.
(v) Discrete frequency distribution: When the given data is represented by tally marks after arranging it in an order. This kind of distribution is called discrete frequency distribution.
(vi) Grouped frequency distribution: If the number of data is large, and the difference between the greatest and the smallest observation is large, then we represent then in groups or classes. Such representation of data is called grouped frequency distribution.
(vii) Class intervals: The difference between the upper limit and lower limit of a class is called class interval.
(viii) Class-size : Class intervals are also called the class size. Each size of the same intervals
(ix) Class limits : Every class has two limits : upper limit and lower limit.
(x) True class limits or Exclusive limits : When the upper limit of one is the lower limit of the next interval then these are call true class limits.

Question 2.
The final marks in mathematics of 30 students are as follows :
53, 61, 48, 60, 78, 68, 55, 100, 67, 90, 75, 88,77,37,84,58,60,48,62,56,44,58,52,64, 98, 59, 70, 39, 50, 60
(i) Arrange these marks in the ascending order, 30 to 39 one group, 40 to 49 second group etc.
Now answer the following:
(ii) What is the highest score ?
(iii) What is the lowest score ?
(iv) What is the range ?
(v) If 40 is the pass mark how many have failed ?
(vi) How many have scored 75 or more ?
(vii) Which observations between 50 and 60 have not actually appeared ?
(viii) How many have scored less than 50 ?
Solution:
(i) Arranging the given data in ascending order.
30 to 39 : 37,39
40 to 49 : 44, 48, 48
50 to 59 : 50, 52, 53, 55, 56, 58, 58, 59
60 to 69 : 60, 60, 60, 61, 62, 64, 67, 68
70 to 79 : 70, 75, 77, 78
80 to 89 : 84, 88
90 to 99 : 90, 98
100 to 109 : 100
(ii) Highest score is 100
(iii) Lowest score is 37
(iv) Range is 100 – 37 = 63
(v) If 40 is pass marks then number of failed candidates will be = 2
(vi) Number of students who scored 75 or more = 8
(vii) Between 50 and 60, the observations 51, 54, 57 do not appear.
(viii) Number of students who scored less than 50 = 5

Question 3.
The weights of new born babies (in kg) in a hospital on a particular day are as follows:
2.3, 2.2, 2.1, 2.7, 2.6,3.0, 2.5, 2.9, 2-8,3.1, 2.5, 2.8, 2.7, 2.9, 2.4.
(i) Rearrange the weights in descending order.
(ii) Determine the highest weight:
(iii) Determine the lowest weight.
(iv) Determine the range.
(v) How many babies were born on that day?
(vi) How many babies weigh below 2.5 kg ?
(vii) How many babies weigh more than 2.8 kg ?
(viii) How many babies weigh 2.8 kg ?
Solution:
(i) Arranging the given weights in descending order.
3.1, 3.0, 2.9, 2.9, 2.8, 2.8, 2.7, 2.7, 2.6, 2.5, 2.5, 2.4, 2.3, 2.2, 2.1
(ii) Highest weight = 3.1 kg
(iii) Lowest weight = 2.1 kg
(iv) Range : 3.1 – 2.1 = 1 kg.
(v) Number of babies born on that day = 15
(vi) Number of babies having weight below 2.5 kg = 4
(vii) Number of babies having weight more than 2.8 kg = 4
(viii) Number of babies weigh 2.8 kg = 2

Question 4.
Following data gives the number of children in 41 families:
1,2,6,5,1,5,1,3,2,6,2,3,4,2,0,0,4,4, 3, 2, 2, 0, 0,1, 2, 2, 4,3, 2,1, 0, 5,1, 2,4, 3, 4, 1, 6, 2, 2.
Represent it in the form of a frequency distribution.
Solution:
Frequency distribution table
RD Sharma Class 8 Solutions Chapter 23 Data Handling I Ex 23.1 1

Question 5.
Prepare a frequency table of the following scores obtained by 50 students in a test:
42, 51, 21, 42, 37. 37, 42, 49, 38, 52, 7, 33, 17, 44, 39, 7, 14, 27, 39, 42, 42, 62, 37, 39, 67, 51, 53, 53, 59, 41, 29, 38, 27, 31, 54,19, 53, 51, 22, 61, 42, 39, 59, 47, 33, 34, 16, 37, 57, 43
Solution:
Frequency distribution table
RD Sharma Class 8 Solutions Chapter 23 Data Handling I Ex 23.1 2

Question 6.
A die was thrown 25 times and following scores were obtained:
1,5,2,4,3,6,1,4,2,5,1,6,2,6,3,5,4,1, 3, 2, 3, 6,1, 5, 2
Prepare a frequency table of the scores.
Solution:
Frequency distribution table
RD Sharma Class 8 Solutions Chapter 23 Data Handling I Ex 23.1 3

Question 7.
In a study of number of accidents per day, the observations for 30 days were obtained as follows:
6,3,5,6,4,3, 2,5,4,2,4,2,1,2, 2,0,5,4,6,1,6,0, 5, 3, 6,1, 5, 5, 2, 6
Prepare a frequency distribution table.
Solution:
Frequency distribution table
RD Sharma Class 8 Solutions Chapter 23 Data Handling I Ex 23.1 4

Question 8.
Prepare a frequency table of the following ages (in years) of 30 students of class VIII in your school:
13,14,13,12,14,13,14,15,13,14,13,14, 16,12,14,13,14,15,16,13,14,13,12,17,13, 12,13,13,13,14
Solution:
Frequency distribution table
RD Sharma Class 8 Solutions Chapter 23 Data Handling I Ex 23.1 5

Question 9.
Following figures relate to the weekly wages (in Rs) of 15 workers in a factory :
300,250,200,250,200,150,350,200,250, 200,150, 300,150, 200, 250 Prepare a frequency table.
(i) What is the range in wages (in Rs) ?
(ii) How many workers are getting Rs 350 ?
(iii) How many workers are getting the minimum wages ?
Solution:
Frequency distribution table
RD Sharma Class 8 Solutions Chapter 23 Data Handling I Ex 23.1 6
(i) Range = 350- 150 = 200
(ii) Number of workers getting Rs 350 = 1
(iii) Number of workers getting minimum wages = 3

Question 10.
Construct a frequency distribution table for the following marks obtained by 25 students in a history test in class Vin of a school:
9,17,12, 20,9,18, 25,17,19,9,12,9,12, 18, 17,19, 20, 25, 9,12,17,19, 19, 20, 9
(i) What is the range of marks ?
(ii) What is the highest mark ?
(iii) Which mark is occurring more frequently ?
Solution:
Frequency distribution table
RD Sharma Class 8 Solutions Chapter 23 Data Handling I Ex 23.1 7
(i) Range = 25 – 9 = 16
(ii) Highest marks = 25
(iii) Marks occurring more frequently = 9


Hope given RD Sharma Class 8 Solutions Chapter 23 Data Handling I Ex 23.1 are helpful to complete your math homework.

If you have any doubts, please comment below. Learn Insta try to provide online math tutoring for you.

RD Sharma Class 8 Solutions Chapter 24 Data Handling II Ex 24.1

RD Sharma Class 8 Solutions Chapter 24 Data Handling II (Graphical Representation of Data as Histograms) Ex 24.1

These Solutions are part of RD Sharma Class 8 Solutions. Here we have given RD Sharma Class 8 Solutions Chapter 24 Data Handling II Ex 24.1

Question 1.
Given below is the frequency distribution of the heights of 50 students of a class :
RD Sharma Class 8 Solutions Chapter 24 Data Handling II Ex 24.1 1
Draw a histogram representing the above data.
Solution:
We represent class intervals along x-axis and frequency along y-axis. Taking suitable intervals along x-axis and y-axis we construct the rectangles as shown in the figure. This is the required histogram.
RD Sharma Class 8 Solutions Chapter 24 Data Handling II Ex 24.1 2

Question 2.
Draw a histogram of the following data :
RD Sharma Class 8 Solutions Chapter 24 Data Handling II Ex 24.1 3
Solution:
We represent class-intervals along x-axis and frequency along y-axis. Taking suitable intervals along x-axis andy-axis, we construct rectangles as shown in the figure. This is the required histogram.
RD Sharma Class 8 Solutions Chapter 24 Data Handling II Ex 24.1 4

Question 3.
Number of workshops organized by a school in different areas during the last five years is as follows :
RD Sharma Class 8 Solutions Chapter 24 Data Handling II Ex 24.1 5
Draw a histogram representing the above data.
Solution:
We represent years along x-axis and number of workshops along y-axis. Taking suitable intervals, we construct rectangles as shown in the figure. This is the required histogram.
RD Sharma Class 8 Solutions Chapter 24 Data Handling II Ex 24.1 6
RD Sharma Class 8 Solutions Chapter 24 Data Handling II Ex 24.1 7

Question 4.
In a hypothetical sample of 20 people the amounts of money with them were found to be as follows :
114, 108,100, 98, 101,109,117,119, 126, 131, 136, 143, 156, 169, 182, 195, 207, 219, 235, 118.
Draw the histogram of the frequency distribution (taking one of the class intervals as 50-100).
Solution:
Highest sample = 235
Lowest sample = 98
Range = 235-98 = 137
Now frequency distribution table will be as under:
RD Sharma Class 8 Solutions Chapter 24 Data Handling II Ex 24.1 8
We represent class intervals along x-axis and frequency along j’-axis. Taking suitable intervals, we construct a rectangles as shown in the figure. This is the required histogram.

Question 5.
Construct a histogram for the following data:
RD Sharma Class 8 Solutions Chapter 24 Data Handling II Ex 24.1 9
Solution:
We represent monthly school fee (in Rs) along x-axis and number of schools along y-axis. Taking suitable intervals, we construct rectangles as shown in the figure. This is the required histogram.
RD Sharma Class 8 Solutions Chapter 24 Data Handling II Ex 24.1 10

Question 6.
Draw a histogram for the daily earnings of 30 drug stores in the following table :
RD Sharma Class 8 Solutions Chapter 24 Data Handling II Ex 24.1 11
Solution:
We represent daily earnings (in Rs) along x-axis and number of stores along y-axis. Taking suitable intervals, we construct rectangles as shown in the figure. This is the required histogram.
RD Sharma Class 8 Solutions Chapter 24 Data Handling II Ex 24.1 12

Question 7.
Draw a histogram to represent the following data:
RD Sharma Class 8 Solutions Chapter 24 Data Handling II Ex 24.1 13
RD Sharma Class 8 Solutions Chapter 24 Data Handling II Ex 24.1 14
Solution:
We represent monthly salary (in Rs) along x-axis and number of teachers along y-axis. Taking suitable intervals we construct rectangles as shown in the figure. This is the required histogram
RD Sharma Class 8 Solutions Chapter 24 Data Handling II Ex 24.1 15

Question 8.
The following histogram shows the number of literate females in the age group of 10 to 40 years in a town :
(i) Write the age group in which the number of literate female is highest.
(ii) What is the class width ?
RD Sharma Class 8 Solutions Chapter 24 Data Handling II Ex 24.1 16
(iii) What is the lowest frequency ?
(iv) What are the class marks of the classes ?
(v) In which age group literate females are least ?
Solution:
(i) The age group in which the number of literate females is 15-20.
(ii) The class width is 5.
(iii) Lowest frequency is 320.
(iv) The class marks of the classes are
\(\frac { 10+15 }{ 2 }\) = \(\frac { 25 }{ 2 }\) =12.5, similarly other class marks will be 17.5,22.5,27.5,32.5,37.5
(v) The least literate females is in the class 10-15

Question 9.
The following histogram shows the monthly wages (in Rs) of workers in a factory:
RD Sharma Class 8 Solutions Chapter 24 Data Handling II Ex 24.1 17
(i) In which wage-group largest number of workers are being kept ? What is their number ?
(ii) What wages are the least number of workers getting ? What is the number of such workers ?
(iii) What is the total number of workers ?
(iv) What is the factory size ?
Solution:
(i) The largest number of workers are in wage group 950-1000 and is 8.
(ii) The least number of workers are in the wage group 900-950 and is 2.
(iii) Total number of workers is 40 (3 + 7 + 5 + 4 + 2 + 8 + 6 + 5)
(iv) The factory size is 50.

Question 10.
Below is the histogram depicting marks obtained by 43 students of a class :
(i) Write the number of students getting highest marks.
(ii) What is the class size ?
RD Sharma Class 8 Solutions Chapter 24 Data Handling II Ex 24.1 18
Solution:
(i) The number of students getting highest marks is 3.
(ii) The class size is 10.

Question 11.
The following histogram shows the frequency distribution of the ages of 22 teachers in a school:
RD Sharma Class 8 Solutions Chapter 24 Data Handling II Ex 24.1 19
(i) What is the number of eldest and youngest teachers in the school ?
(ii) Which age group teachers are more in the school and which least ?
(iii) What is the size of the classes ?
(iv) What are the class marks of the classes?
Solution:
(i) The number of eldest teacher is 1 and the number of youngest teacher is 2.
(ii) The teachers in age group 35-40 is most.
(iii) Size of classes is 5.
(iv) Class marks of class 20-25 is \(\frac { 20+25 }{ 2 }\)= \(\frac { 45 }{ 2 }\) = 22.5
and similarly others will be 27.5, 32.5, 37.5, 42.5, 47.5, 52.5.

Question 12.
The weekly wages of 30 workers in a factory are given:
830,835,890,810,835,836,869,845,898, 890, 820, 860, 832, 833, 855, 845, 804, 808, 812, 840, 885, 835, 835, 836, 878, 840, 868, 890, 806, 840
Mark a frequency table with intervals as 800-810,810-820 and so on, using tally marks.
Also, draw a histogram and answer the following questions:
(i) Which group has the maximum number of workers ?
(ii) How many workers earn Rs 850 and more ?
(iii) How many workers earn less than Rs 850?
Solution:
The frequency table will be as given below:
RD Sharma Class 8 Solutions Chapter 24 Data Handling II Ex 24.1 20
We represent wages (in Rs) along x-axis and number of workers along y-axis. Taking suitable intervals, we construct rectangles as shown in the figure. This is the required histogram.
(i) Maximum workers are in the wage group 830-840.
(ii) Number of workers getting Rs 850 and more are 1 + 3 + 1 + 1 + 4 = 10.
(iii) Number of workers getting less than Rs 850 are 3 + 2 + 1 + 9 + 5 = 20
RD Sharma Class 8 Solutions Chapter 24 Data Handling II Ex 24.1 21

Hope given RD Sharma Class 8 Solutions Chapter 24 Data Handling II Ex 24.1 are helpful to complete your math homework.

If you have any doubts, please comment below. Learn Insta try to provide online math tutoring for you.