RD Sharma Class 8 Solutions Chapter 23 Data Handling I (Classification and Tabulation of Data) Ex 23.1
These Solutions are part of RD Sharma Class 8 Solutions. Here we have given RD Sharma Class 8 Solutions Chapter 23 Data Handling I Ex 23.1
Other Exercises
- RD Sharma Class 8 Solutions Chapter 23 Data Handling I Ex 23.1
- RD Sharma Class 8 Solutions Chapter 23 Data Handling I Ex 23.2
Question 1.
Define the following terms :
(i) Observations
(ii) Raw data
(iii) Frequency of an observation
(iv) Frequency distribution
(v) Discrete frequency distribution
(vi) Grouped frequency distribution
(vii) Class-interval
(viii) Class-size
(ix) Class limits
(x) True class limits
Solution:
(i) Observations : Each entry in the given data is called an observation. ‘
(ii) Raw data: A collection of observations by an observer, is called raw data.
(iii) Frequency of an observation : The number of times an observation occurs in the given data is called its frequency.
(iv) Frequency distribution : The presentations of given data in order of magnitude ascending or descending, is called the frequency distribution.
(v) Discrete frequency distribution: When the given data is represented by tally marks after arranging it in an order. This kind of distribution is called discrete frequency distribution.
(vi) Grouped frequency distribution: If the number of data is large, and the difference between the greatest and the smallest observation is large, then we represent then in groups or classes. Such representation of data is called grouped frequency distribution.
(vii) Class intervals: The difference between the upper limit and lower limit of a class is called class interval.
(viii) Class-size : Class intervals are also called the class size. Each size of the same intervals
(ix) Class limits : Every class has two limits : upper limit and lower limit.
(x) True class limits or Exclusive limits : When the upper limit of one is the lower limit of the next interval then these are call true class limits.
Question 2.
The final marks in mathematics of 30 students are as follows :
53, 61, 48, 60, 78, 68, 55, 100, 67, 90, 75, 88,77,37,84,58,60,48,62,56,44,58,52,64, 98, 59, 70, 39, 50, 60
(i) Arrange these marks in the ascending order, 30 to 39 one group, 40 to 49 second group etc.
Now answer the following:
(ii) What is the highest score ?
(iii) What is the lowest score ?
(iv) What is the range ?
(v) If 40 is the pass mark how many have failed ?
(vi) How many have scored 75 or more ?
(vii) Which observations between 50 and 60 have not actually appeared ?
(viii) How many have scored less than 50 ?
Solution:
(i) Arranging the given data in ascending order.
30 to 39 : 37,39
40 to 49 : 44, 48, 48
50 to 59 : 50, 52, 53, 55, 56, 58, 58, 59
60 to 69 : 60, 60, 60, 61, 62, 64, 67, 68
70 to 79 : 70, 75, 77, 78
80 to 89 : 84, 88
90 to 99 : 90, 98
100 to 109 : 100
(ii) Highest score is 100
(iii) Lowest score is 37
(iv) Range is 100 – 37 = 63
(v) If 40 is pass marks then number of failed candidates will be = 2
(vi) Number of students who scored 75 or more = 8
(vii) Between 50 and 60, the observations 51, 54, 57 do not appear.
(viii) Number of students who scored less than 50 = 5
Question 3.
The weights of new born babies (in kg) in a hospital on a particular day are as follows:
2.3, 2.2, 2.1, 2.7, 2.6,3.0, 2.5, 2.9, 2-8,3.1, 2.5, 2.8, 2.7, 2.9, 2.4.
(i) Rearrange the weights in descending order.
(ii) Determine the highest weight:
(iii) Determine the lowest weight.
(iv) Determine the range.
(v) How many babies were born on that day?
(vi) How many babies weigh below 2.5 kg ?
(vii) How many babies weigh more than 2.8 kg ?
(viii) How many babies weigh 2.8 kg ?
Solution:
(i) Arranging the given weights in descending order.
3.1, 3.0, 2.9, 2.9, 2.8, 2.8, 2.7, 2.7, 2.6, 2.5, 2.5, 2.4, 2.3, 2.2, 2.1
(ii) Highest weight = 3.1 kg
(iii) Lowest weight = 2.1 kg
(iv) Range : 3.1 – 2.1 = 1 kg.
(v) Number of babies born on that day = 15
(vi) Number of babies having weight below 2.5 kg = 4
(vii) Number of babies having weight more than 2.8 kg = 4
(viii) Number of babies weigh 2.8 kg = 2
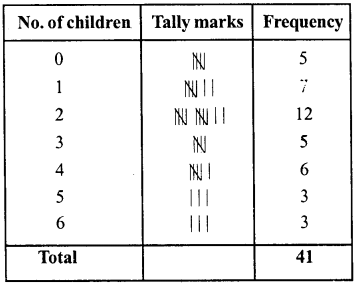
Question 4.
Following data gives the number of children in 41 families:
1,2,6,5,1,5,1,3,2,6,2,3,4,2,0,0,4,4, 3, 2, 2, 0, 0,1, 2, 2, 4,3, 2,1, 0, 5,1, 2,4, 3, 4, 1, 6, 2, 2.
Represent it in the form of a frequency distribution.
Solution:
Frequency distribution table
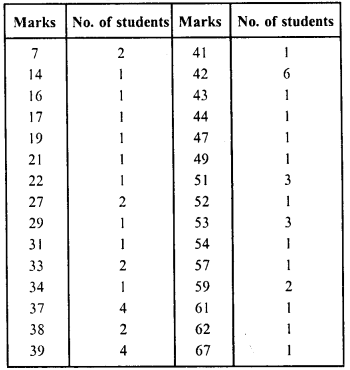
Question 5.
Prepare a frequency table of the following scores obtained by 50 students in a test:
42, 51, 21, 42, 37. 37, 42, 49, 38, 52, 7, 33, 17, 44, 39, 7, 14, 27, 39, 42, 42, 62, 37, 39, 67, 51, 53, 53, 59, 41, 29, 38, 27, 31, 54,19, 53, 51, 22, 61, 42, 39, 59, 47, 33, 34, 16, 37, 57, 43
Solution:
Frequency distribution table
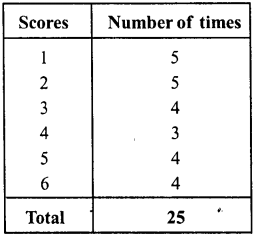
Question 6.
A die was thrown 25 times and following scores were obtained:
1,5,2,4,3,6,1,4,2,5,1,6,2,6,3,5,4,1, 3, 2, 3, 6,1, 5, 2
Prepare a frequency table of the scores.
Solution:
Frequency distribution table
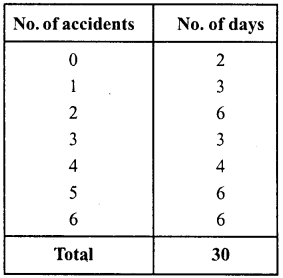
Question 7.
In a study of number of accidents per day, the observations for 30 days were obtained as follows:
6,3,5,6,4,3, 2,5,4,2,4,2,1,2, 2,0,5,4,6,1,6,0, 5, 3, 6,1, 5, 5, 2, 6
Prepare a frequency distribution table.
Solution:
Frequency distribution table
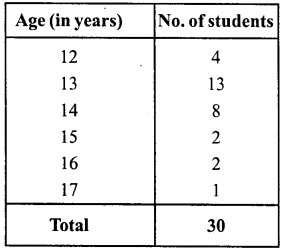
Question 8.
Prepare a frequency table of the following ages (in years) of 30 students of class VIII in your school:
13,14,13,12,14,13,14,15,13,14,13,14, 16,12,14,13,14,15,16,13,14,13,12,17,13, 12,13,13,13,14
Solution:
Frequency distribution table
Question 9.
Following figures relate to the weekly wages (in Rs) of 15 workers in a factory :
300,250,200,250,200,150,350,200,250, 200,150, 300,150, 200, 250 Prepare a frequency table.
(i) What is the range in wages (in Rs) ?
(ii) How many workers are getting Rs 350 ?
(iii) How many workers are getting the minimum wages ?
Solution:
Frequency distribution table
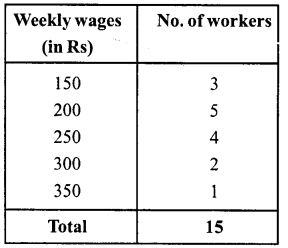
(i) Range = 350- 150 = 200
(ii) Number of workers getting Rs 350 = 1
(iii) Number of workers getting minimum wages = 3
Question 10.
Construct a frequency distribution table for the following marks obtained by 25 students in a history test in class Vin of a school:
9,17,12, 20,9,18, 25,17,19,9,12,9,12, 18, 17,19, 20, 25, 9,12,17,19, 19, 20, 9
(i) What is the range of marks ?
(ii) What is the highest mark ?
(iii) Which mark is occurring more frequently ?
Solution:
Frequency distribution table
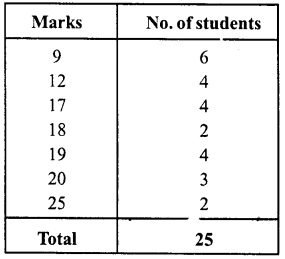
(i) Range = 25 – 9 = 16
(ii) Highest marks = 25
(iii) Marks occurring more frequently = 9
Hope given RD Sharma Class 8 Solutions Chapter 23 Data Handling I Ex 23.1 are helpful to complete your math homework.
If you have any doubts, please comment below. Learn Insta try to provide online math tutoring for you.