RD Sharma Class 8 Solutions Chapter 23 Data Handling I Ex 23.2
These Solutions are part of RD Sharma Class 8 Solutions. Here we have given RD Sharma Class 8 Solutions Chapter 23 Data Handling I Ex 23.2
Other Exercises
- RD Sharma Class 8 Solutions Chapter 23 Data Handling I Ex 23.1
- RD Sharma Class 8 Solutions Chapter 23 Data Handling I Ex 23.2
Question 1.
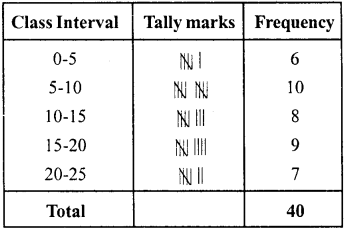
The marks obtained by 40 students of class VIII in an examination are given below :
16, 17, 18, 3, 7, 23, 18, 13, 10, 21, 7, 1, 13,
21, 13, 15, 19, 24, 16, 3, 23, 5, 12, 18, 8, 12, 6,
8, 16, 5, 3, 5, 0, 7, 9, 12, 20, 10, 2, 23.
Divide the data into five groups, namely 0-5,5-10,10-15,15-20 and 20-25 and prepare a grouped frequency table.
Solution:
Frequency distribution table
Question 2.
The marks scored by 20 students in a test are given below :
54, 42, 68, 56, 62, 71, 78, 51, 72, 53, 44, 58, 47, 64, 41, 57, 89, 53, 84, 57.
Complete the following frequency table :
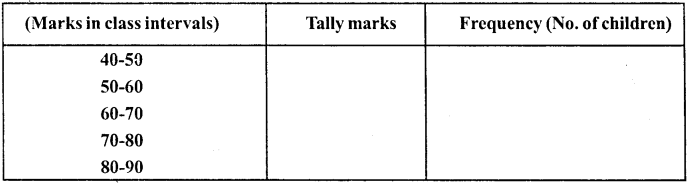
What is the class interval in which the greatest frequency occurs ?
Solution:
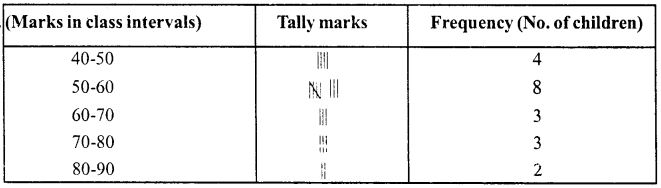
The class in which the greatest frequency is 50-60
Question 3.
The following is the distribution of weights (in kg) of 52 persons :
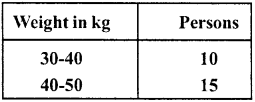
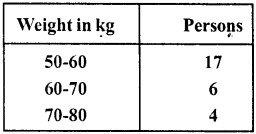
(i) What is the lower limit of class 50-60 ?
(ii) Find the class marks of the classes 40-50, 50-60.
(iii) What is the class size ?
Solution:
(i) Lower limit of class 50-60 = 50
(ii) Class marks of 40-50 = \(\frac { 40+50 }{ 2 }\) = \(\frac { 90 }{ 2 }\)
= 45 and of 50-60 = \(\frac { 50+60 }{ 2 }\) = \(\frac { 110 }{ 2 }\) =55
(iii) Class size is 10
Question 4.
Construct a frequency table for the following weights (in gm) of 35 mangoes using the equal class intervals, one of them is 40-45 (45 not included):
30,40,45,32,43,50,55,62,70,70,61,62, 53,52, 50,42,35,37,53,55,65,70, 73, 74,45, 46, 58, 59, 60, 62, 74, 34, 35, 70 ,68.
(i) What is the class mark of the class interval 40-45 ?
(ii) What is the range of the above weights ?
(iii) How many classes are there ?
Solution:
Smallest observation = 30
Greatest observation = 74
Range = 74 – 30 = 44
Now forming the distribution table
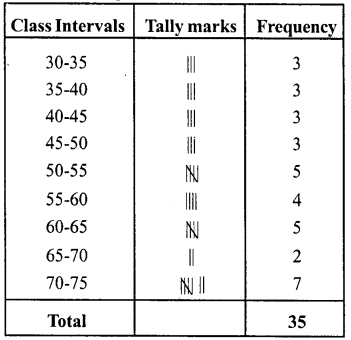
(i) Class mark of 40-45
= \(\frac { 40+45 }{ 2 }\) = \(\frac { 85 }{ 2 }\) = 42.5
(ii) Range = 74 – 30 = 44
(iii) Number of classes are 9
Question 5.
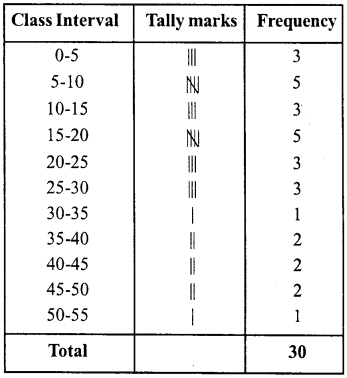
Construct a frequency table with class-intervals 0-5 (5 not included) of the following marks obtained by a group of 30 students in an examination :
0, 5, 7,10, 12,15, 20, 22, 25, 27, 8, 11, 17,3, 6, 9,17,19, 21, 29, 31,35,37,40,42, 45, 49, 4, 50, 16.
Solution:
Frequency distribution table.
Question 6.
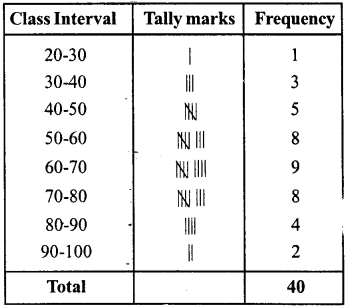
The marks scored by 40 students of class VIII in mathematics are given below:
81,55, 68, 79,85,43,29,68,54,73,47, 35, 72,64,95,44,50, 77,64,35,79, 52, 45,54,70,83, 62′, 64,72,92,84,76,63, 43, 54, 38, 73, 68, 52, 54.
Prepare a frequency distribution with class size of 10 marks.
Solution:
Largest marks = 95
Lowest marks = 29
Range = 95 – 29 = 66
Frequency distribution table
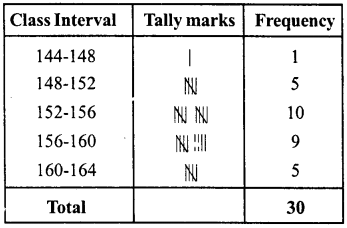
Question 7.
The heights (in cm) of 30 students of class VIII are given below :
155.158.154.158.160.148.149.150.153, 159,161,148,157,153,157,162,159,151, 154,156,152,156,160,152,147,155,163,155,157,153.
Prepare a frequency distribution table with 160-164 as one of the class intervals.
Solution:
Largest height =163
Lowest height =147
Range = 163- 147 = 16
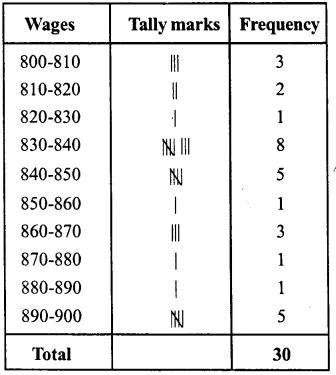
Question 8.
The monthly wages of 30 workers in a factory are given below :
830,835,890,810,835,836,869,845,898, 890, 820, 860, 832, 833, 855, 845, 804, 808, 812, 840, 885, 835, 836, 878, 840, 868, 890, 806, 840, 890.
Represent the data in the form of a frequency distribution with class size 10.
Solution:
Highest wage = 898
Lowest wage = 804
Range = 898 – 804 = 94
Frequency distribution table
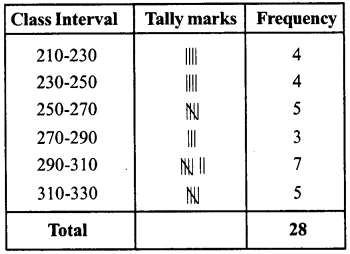
Question 9.
Construct a frequency table with equal class intervals from the following data on the monthly wages (in rupees) at 28 labourers working in a factory, taking one of the class intervals as 210-230 (230 not included):
220, 268, 258, 242, 210, 268, 272,242, 311, 290, 300, 320,319,304,302,318,306,292, 254, 278, 210,240, 280,316,306, 215, 256, 236.
Solution:
Highest wages = 320
Lowest wages = 210
Range = 320-210= 110
Frequency distribution table
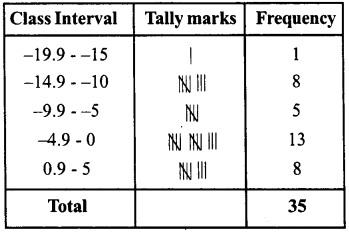
Question 10.
The daily minimum temperatures in degrees Celsius recorded in a certain Arctic region are as follows :
-12.5, -10.8, -18.6, -8.4, -10.8, -4.2, -4.8, -6.7, -13.2, -11.8, -2.3,1.2, 2.6, 0, -2.4, 0, 3.2, 2.7,3.4,0, -2.4, -2.4, 0,3.2, 2.7,3.4, 0,2.4, -5.8, -8.9, -14.6, -12.3, -11.5, -7.8, – 2.9
Represent them as frequency distribution table taking -19.9 to -15 as the first class interval.
Solution:
Lowest temperature = -19.9
Highest temperature = 3.4
Frequency distribution table
Hope given RD Sharma Class 8 Solutions Chapter 23 Data Handling I Ex 23.2 are helpful to complete your math homework.
If you have any doubts, please comment below. Learn Insta try to provide online math tutoring for you.