RD Sharma Class 8 Solutions Chapter 24 Data Handling II (Graphical Representation of Data as Histograms) Ex 24.1
These Solutions are part of RD Sharma Class 8 Solutions. Here we have given RD Sharma Class 8 Solutions Chapter 24 Data Handling II Ex 24.1
Question 1.
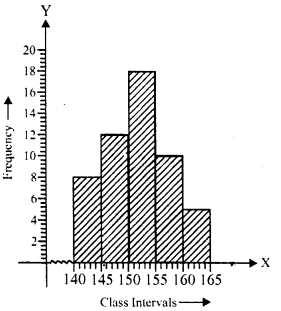
Given below is the frequency distribution of the heights of 50 students of a class :
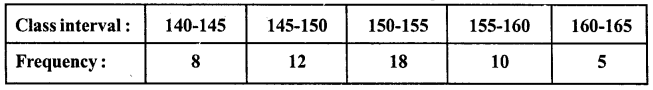
Draw a histogram representing the above data.
Solution:
We represent class intervals along x-axis and frequency along y-axis. Taking suitable intervals along x-axis and y-axis we construct the rectangles as shown in the figure. This is the required histogram.
Question 2.
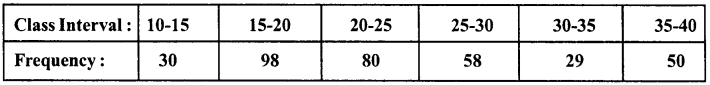
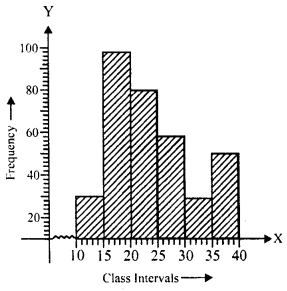
Draw a histogram of the following data :
Solution:
We represent class-intervals along x-axis and frequency along y-axis. Taking suitable intervals along x-axis andy-axis, we construct rectangles as shown in the figure. This is the required histogram.
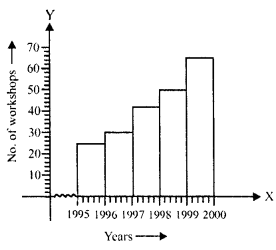
Question 3.
Number of workshops organized by a school in different areas during the last five years is as follows :
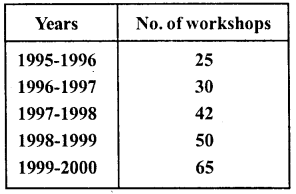
Draw a histogram representing the above data.
Solution:
We represent years along x-axis and number of workshops along y-axis. Taking suitable intervals, we construct rectangles as shown in the figure. This is the required histogram.
Question 4.
In a hypothetical sample of 20 people the amounts of money with them were found to be as follows :
114, 108,100, 98, 101,109,117,119, 126, 131, 136, 143, 156, 169, 182, 195, 207, 219, 235, 118.
Draw the histogram of the frequency distribution (taking one of the class intervals as 50-100).
Solution:
Highest sample = 235
Lowest sample = 98
Range = 235-98 = 137
Now frequency distribution table will be as under:
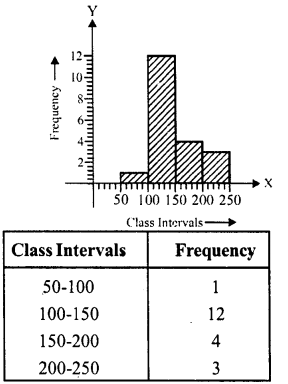
We represent class intervals along x-axis and frequency along j’-axis. Taking suitable intervals, we construct a rectangles as shown in the figure. This is the required histogram.
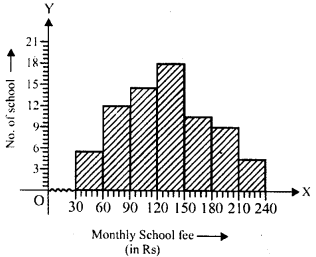
Question 5.
Construct a histogram for the following data:
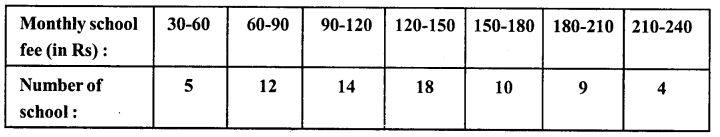
Solution:
We represent monthly school fee (in Rs) along x-axis and number of schools along y-axis. Taking suitable intervals, we construct rectangles as shown in the figure. This is the required histogram.
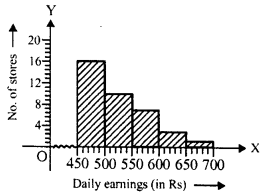
Question 6.
Draw a histogram for the daily earnings of 30 drug stores in the following table :
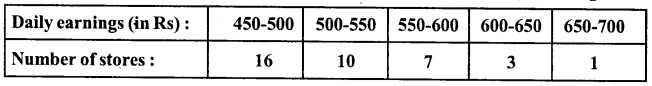
Solution:
We represent daily earnings (in Rs) along x-axis and number of stores along y-axis. Taking suitable intervals, we construct rectangles as shown in the figure. This is the required histogram.
Question 7.
Draw a histogram to represent the following data:
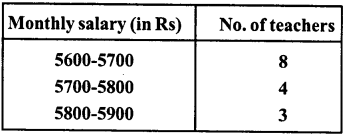
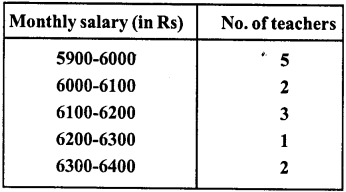
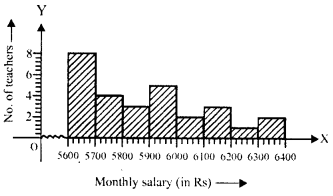
Solution:
We represent monthly salary (in Rs) along x-axis and number of teachers along y-axis. Taking suitable intervals we construct rectangles as shown in the figure. This is the required histogram
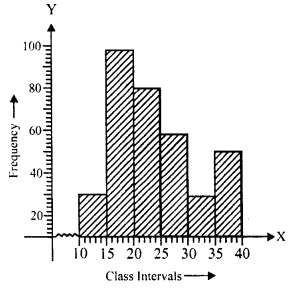
Question 8.
The following histogram shows the number of literate females in the age group of 10 to 40 years in a town :
(i) Write the age group in which the number of literate female is highest.
(ii) What is the class width ?
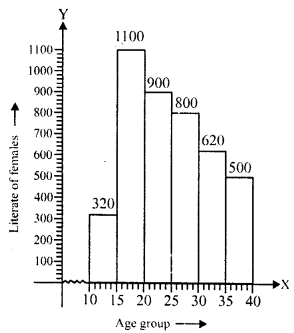
(iii) What is the lowest frequency ?
(iv) What are the class marks of the classes ?
(v) In which age group literate females are least ?
Solution:
(i) The age group in which the number of literate females is 15-20.
(ii) The class width is 5.
(iii) Lowest frequency is 320.
(iv) The class marks of the classes are
\(\frac { 10+15 }{ 2 }\) = \(\frac { 25 }{ 2 }\) =12.5, similarly other class marks will be 17.5,22.5,27.5,32.5,37.5
(v) The least literate females is in the class 10-15
Question 9.
The following histogram shows the monthly wages (in Rs) of workers in a factory:
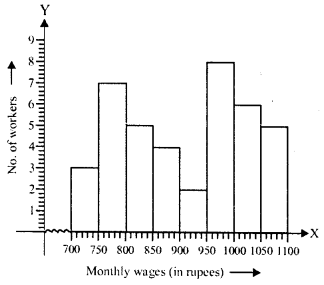
(i) In which wage-group largest number of workers are being kept ? What is their number ?
(ii) What wages are the least number of workers getting ? What is the number of such workers ?
(iii) What is the total number of workers ?
(iv) What is the factory size ?
Solution:
(i) The largest number of workers are in wage group 950-1000 and is 8.
(ii) The least number of workers are in the wage group 900-950 and is 2.
(iii) Total number of workers is 40 (3 + 7 + 5 + 4 + 2 + 8 + 6 + 5)
(iv) The factory size is 50.
Question 10.
Below is the histogram depicting marks obtained by 43 students of a class :
(i) Write the number of students getting highest marks.
(ii) What is the class size ?
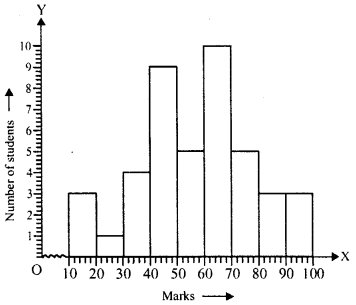
Solution:
(i) The number of students getting highest marks is 3.
(ii) The class size is 10.
Question 11.
The following histogram shows the frequency distribution of the ages of 22 teachers in a school:
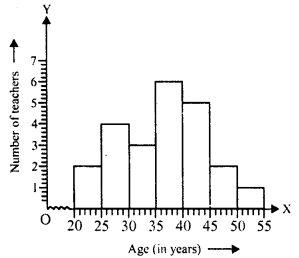
(i) What is the number of eldest and youngest teachers in the school ?
(ii) Which age group teachers are more in the school and which least ?
(iii) What is the size of the classes ?
(iv) What are the class marks of the classes?
Solution:
(i) The number of eldest teacher is 1 and the number of youngest teacher is 2.
(ii) The teachers in age group 35-40 is most.
(iii) Size of classes is 5.
(iv) Class marks of class 20-25 is \(\frac { 20+25 }{ 2 }\)= \(\frac { 45 }{ 2 }\) = 22.5
and similarly others will be 27.5, 32.5, 37.5, 42.5, 47.5, 52.5.
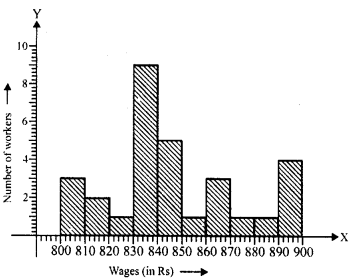
Question 12.
The weekly wages of 30 workers in a factory are given:
830,835,890,810,835,836,869,845,898, 890, 820, 860, 832, 833, 855, 845, 804, 808, 812, 840, 885, 835, 835, 836, 878, 840, 868, 890, 806, 840
Mark a frequency table with intervals as 800-810,810-820 and so on, using tally marks.
Also, draw a histogram and answer the following questions:
(i) Which group has the maximum number of workers ?
(ii) How many workers earn Rs 850 and more ?
(iii) How many workers earn less than Rs 850?
Solution:
The frequency table will be as given below:
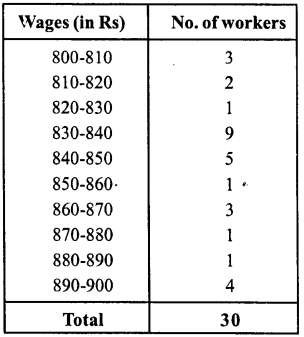
We represent wages (in Rs) along x-axis and number of workers along y-axis. Taking suitable intervals, we construct rectangles as shown in the figure. This is the required histogram.
(i) Maximum workers are in the wage group 830-840.
(ii) Number of workers getting Rs 850 and more are 1 + 3 + 1 + 1 + 4 = 10.
(iii) Number of workers getting less than Rs 850 are 3 + 2 + 1 + 9 + 5 = 20
Hope given RD Sharma Class 8 Solutions Chapter 24 Data Handling II Ex 24.1 are helpful to complete your math homework.
If you have any doubts, please comment below. Learn Insta try to provide online math tutoring for you.