RS Aggarwal Class 9 Solutions Chapter 14 Statistics Ex 14D
These Solutions are part of RS Aggarwal Solutions Class 9. Here we have given RS Aggarwal Solutions Class 9 Chapter 14 Statistics Ex 14D.
Other Exercises
- RS Aggarwal Solutions Class 9 Chapter 14 Statistics Ex 14A
- RS Aggarwal Solutions Class 9 Chapter 14 Statistics Ex 14B
- RS Aggarwal Solutions Class 9 Chapter 14 Statistics Ex 14C
- RS Aggarwal Solutions Class 9 Chapter 14 Statistics Ex 14D
- RS Aggarwal Solutions Class 9 Chapter 14 Statistics Ex 14E
- RS Aggarwal Solutions Class 9 Chapter 14 Statistics Ex 14F
- RS Aggarwal Solutions Class 9 Chapter 14 Statistics Ex 14G
- RS Aggarwal Solutions Class 9 Chapter 14 Statistics Ex 14H
Question 1.
Solution:
(i) First eight natural numbers are 1, 2, 3, 4, 5, 6, 7, 8
∴ Mean = \(\frac { 1+2+3+4+5+6+7+8 }{ 8 } \) = \(\frac { 36 }{ 8 } \) = \(\frac { 9 }{ 2 } \) = 4.5
(ii) First ten odd numbers are 1, 3, 5, 7, 9, 11, 13, 15, 17, 19
∴ Mean = \(\frac { 1+3+5+7+9+11+13+15+17+179 }{ 10 } \) = \(\frac { 100 }{ 10 } \) = 10
(iii) First five prime numbers are 2, 3, 5, 7, 11.
∴ Mean = \(\frac { 2+3+5+7+11 }{ 5 } \) = \(\frac { 28 }{ 5 } \) = 5.6
(iv) First six even numbers are 2, 4, 6, 8, 10, 12
∴ Mean = \(\frac { 2+4+6+8+10+12 }{ 10 } \) = \(\frac { 42 }{ 6 } \) = 7
(v) First seven multiples of 5 are 5, 10, 15, 20, 25, 30, 35
∴ Mean = \(\frac { 5+10+15+20+25+30+35 }{ 7 } \) = \(\frac { 140 }{ 7 } \) = 20
(vi) All the factors of 20 are, 1, 2, 4, 5, 10, 20
∴ Mean = \(\frac { 1+2+4+5+10+20 }{ 6 } \) = \(\frac { 42 }{ 6 } \) = 7
Question 2.
Solution:
No. of families (n) = 10
Sum of children (∑x1) = 2 + 4 + 3 + 4 + 2 + 0 + 3 + 5 + 1 + 6 = 30
∴ Mean \(\left( \overline { x } \right) =\frac { \sum { x1 } }{ n } =\frac { 30 }{ 10 } =3\)
Question 3.
Solution:
Here number of days (n) = 7
Number of books (∑x1) = 105 + 216 + 322 + 167 + 273 + 405 + 346 = 1834
∴ Mean \(\left( \overline { x } \right) =\frac { \sum { x1 } }{ n } =\frac { 1864 }{ 7 } =262 books\)
Question 4.
Solution:
Number of days (n) = 6
Sum of temperature (∑x) = 35.5 + 30.8 + 27.3 + 32.1 + 23.8 + 29.9 = 179.4°F
∴ Mean temperature = \(\frac { \sum { x } }{ n } =\frac { 179.4 }{ 6 } \)=29.9°F
Question 5.
Solution:
Number of students (n) = 12
Sum of marks (∑x) = 64 + 36 + 47 + 23 + 0 + 19 + 81 + 93 + 72 + 35 + 3 + 1 = 474
= \(\frac { \sum { x1 } }{ n } =\frac { 474 }{ 12 } \) = 39.5
Question 6.
Solution:
Here, n = 6
and arithmetic mean =13
Total sum = 13 x 6 = 78.
But sum of 7 + 9+ 11 + 13 + 21=61
Value of x = 78 – 61 = 17
Hence x = 17 Ans.
Question 7.
Solution:
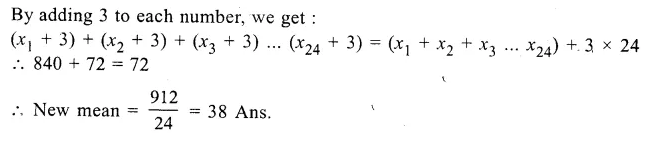
Let x1, x2, x3, … x24 be the 24 numbers
\(\frac { x1+x2+x3+…..+x24 }{ 24 } =35\)
=> x1 + x2 + x3 +….+ x24 = 35 x 24
Question 8.
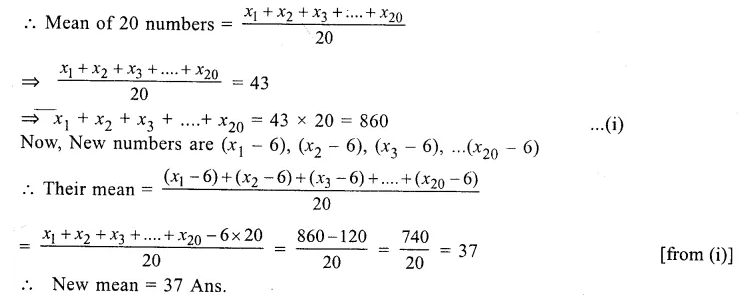
Solution:
Let x1 + x2 + x3……..x20 be the 20 numbers
Question 9.
Solution:
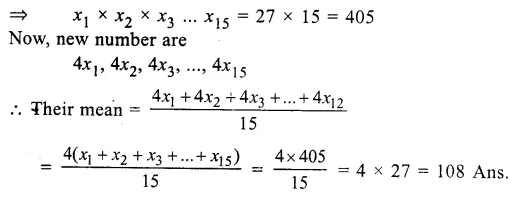
Let x1, x2, x3 … x15 be the numbers
Mean = \(\frac { x1+x2+x3+…..+x15 }{ 15 } = 27\)
Question 10.
Solution:
Let x1, x2, x3 … x12 be the numbers
Mean = \(\frac { x1+x2+x3+…..+x12 }{ 12 }\) = 40
=> x1+x2+x3+….+x12 = 40 X 12 =480
Now,new numbers are \(\frac { x1 }{ 8 } ,\frac { x2 }{ 8 } ,\frac { x3 }{ 8 } ,..\frac { x12 }{ 8 } \)
Mean = \(\frac { \frac { x1 }{ 8 } +\frac { x2 }{ 8 } +\frac { x3 }{ 8 } +…..+\frac { x12 }{ 8 } }{ 12 } \)
= \(\frac { 1 }{ 8 } \frac { \left( x1+x2+x3+….x12 \right) }{ 12 } \)
= \(\frac { 480 }{ 8X12 } \) = 5
Mean of new numbers =5
Question 11.
Solution:
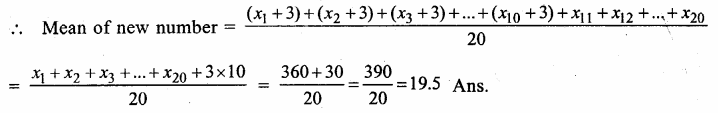
Let x1, x2, x3,…..x20 are the numbers
Mean = \(\frac { x1+x2+x3+…x20 }{ 20 }\) = 18
=> x1 + x2 + x3 +….+ x20 = 18 X 20 =360
Question 12.
Solution:
Mean weight of 6 boys = 48 kg
Their total weight = 48 x 6 = 288 kg
Weights of 5 boys among them, are 51 kg, 45 kg, 49 kg, 46 kg and 44 kg
Sum of weight of 5 boys = (51 + 45 + 49 + 46 + 44) kg = 235 kg
Weight of 6th boy = 288 kg – 235 kg = 53 kg Ans.
Question 13.
Solution:
Mean of 50 students = 39
Total score = 39 x 50 = 1950
Now correct sum of scores = 1950 – Wrong item + Correct item= 1950 – 23 + 43
= 1950 + 20 = 1970
Correct mean = \(\frac { 1970 }{ 50 } \) = 39.4 Ans.
Question 14.
Solution:
Mean of 100 items = 64
The sum of 100 items = 64 x 100 = 6400
New sum of 100 items = 6400 + 36 + 90 – 26 – 9 = 6526 – 35 = 6491,
Correct mean = \(\frac { 6491 }{ 100 }\) =64.91 = 64.91 Ans.
Question 15.
Solution:
Mean of 6 numbers = 23
Sum of 6 numbers = 23 x 6 = 138
Excluding one number, the mean of remaining 5 numbers = 20
Total of 5 numbers = 20 x 5 = 100
Excluded number = 138 – 100 = 38 Ans.
Hope given RS Aggarwal Solutions Class 9 Chapter 14 Statistics Ex 14D are helpful to complete your math homework.
If you have any doubts, please comment below. Learn Insta try to provide online math tutoring for you.