RS Aggarwal Class 9 Solutions Chapter 14 Statistics Ex 14C
These Solutions are part of RS Aggarwal Solutions Class 9. Here we have given RS Aggarwal Solutions Class 9 Chapter 14 Statistics Ex 14C.
Other Exercises
- RS Aggarwal Solutions Class 9 Chapter 14 Statistics Ex 14A
- RS Aggarwal Solutions Class 9 Chapter 14 Statistics Ex 14B
- RS Aggarwal Solutions Class 9 Chapter 14 Statistics Ex 14C
- RS Aggarwal Solutions Class 9 Chapter 14 Statistics Ex 14D
- RS Aggarwal Solutions Class 9 Chapter 14 Statistics Ex 14E
- RS Aggarwal Solutions Class 9 Chapter 14 Statistics Ex 14F
- RS Aggarwal Solutions Class 9 Chapter 14 Statistics Ex 14G
- RS Aggarwal Solutions Class 9 Chapter 14 Statistics Ex 14H
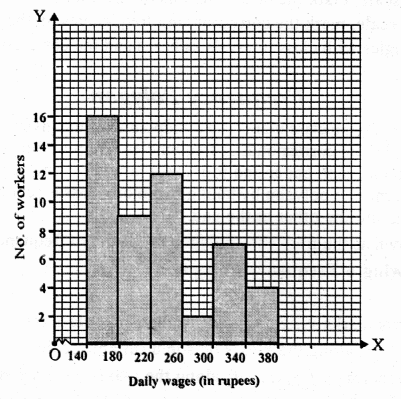
Question 1.
Solution:
It is clear that the given frequency distribution is in exclusive form, we represent the daily wages (in rupees) along x-axis and no. of workers along y-axis. Then we construct rectangles with class intervals as bases and corresponding frequencies as heights as shown given below:
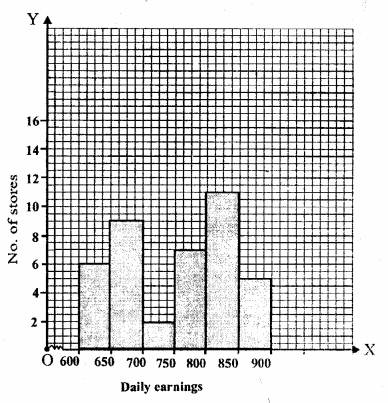
Question 2.
Solution:
We shall take daily earnings along x-axis and number of stores along y-axis. Then we construct rectangles with the given class intervals as bases and corresponding frequency as height as shown in the graph.
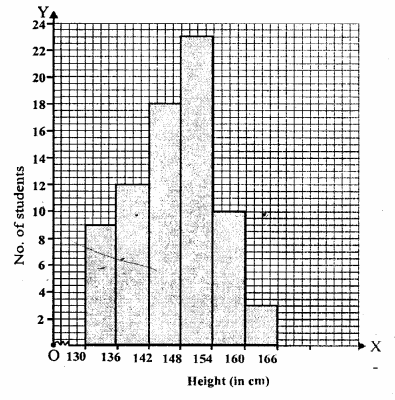
Question 3.
Solution:
We shall take heights along x-axis and number of students along y-axis. Then we shall complete the rectangles with the given class intervals as bases and frequency as height and complete the histogram as shown below :
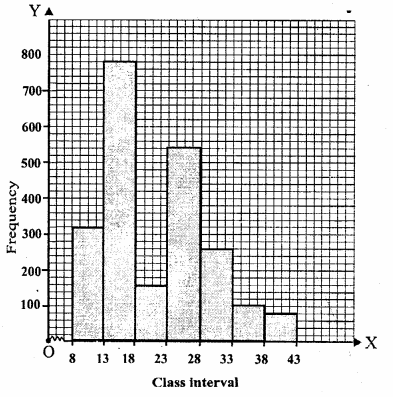
Question 4.
Solution:
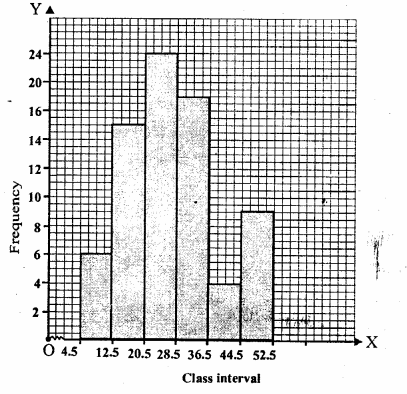
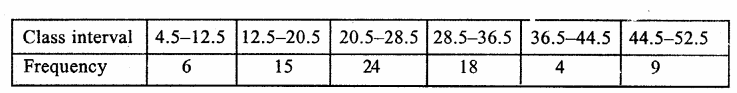
We shall take class intervals along x-axis and frequency along y-axis Then we shall complete the rectangles with given class interval as bases and frequency as heights and complete the histogram as shown below.
Question 5.
Solution:
The given frequency distribution is in inclusive form first we convert it into exclusive form at given below.
Now, we shall take class intervals along x-axis and frequency along y-axis and draw rectangles with class intervals as bases and frequency as heights and complete the histogram as shown.
Question 6.
Solution:
Question 7.
Solution:
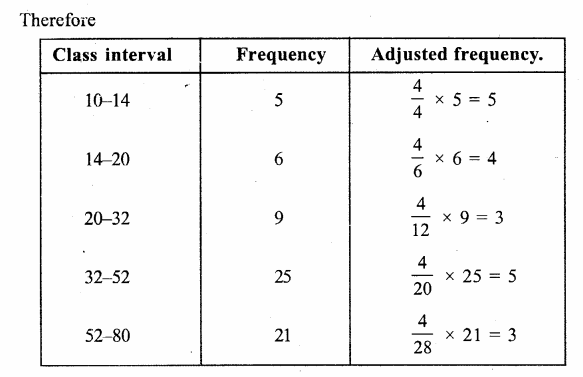
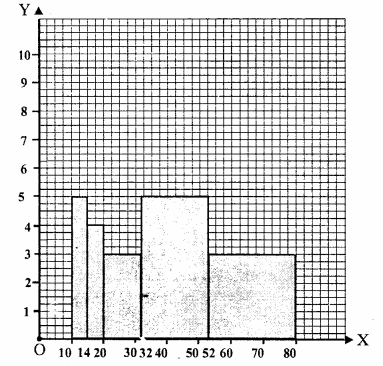
In the given distribution class intervals are different size. So, we shall calculate the adjusted frequency for each class. Here minimum class size is 4. We know that adjusted
frequency of the class is \(\frac { max\quad class\quad size }{ class\quad size\quad of\quad this\quad class } \) x its frequency
Question 8.
Solution:
We shall take two imagined classes one 0-10 at the beginning with zero frequency a id other 70-80 at the end with zero frequency.
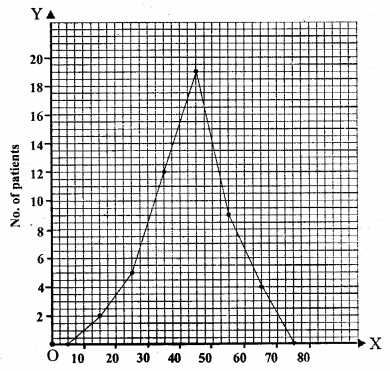
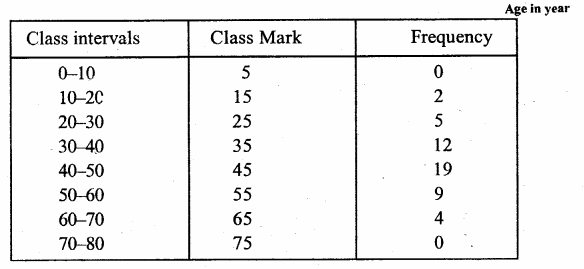
Now, plot the points” (5, 0), (15, 2), (25, 5), (35, 12), (45, 19), (55, 9), (65, 4), (75, 0) on the graph and join them its order to get a polygon as shown below.
Question 9.
Solution:
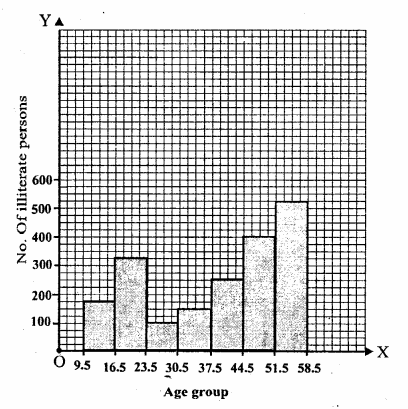
We take Age (in years) along x-axis and number of patients along y-axis. First we complete the histogram and them join the midpoints of their tops in order
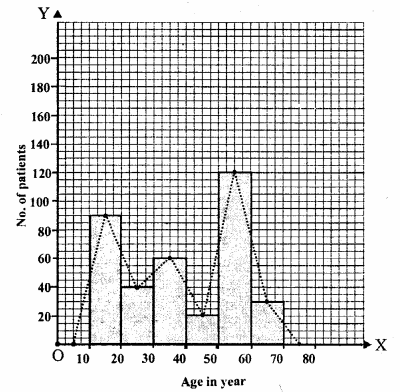
We also take two imagined classes. One 0-10 at the beginning and other 70-80 at the end and also join their midpoints to complete the polygon as shown.
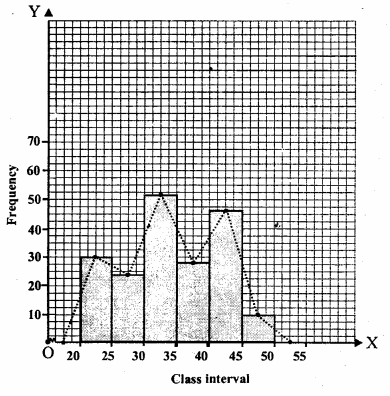
Question 10.
Solution:
We take class intervals along x-axis and frequency along y-axis.
First we complete the histogram and then join the midpoints of the tops of adjacent rectangles in order. We shall take two imagined classes 15-20 at the beginning and 50-55 at the end.
We also join their midpoints to complete the polygon as shown
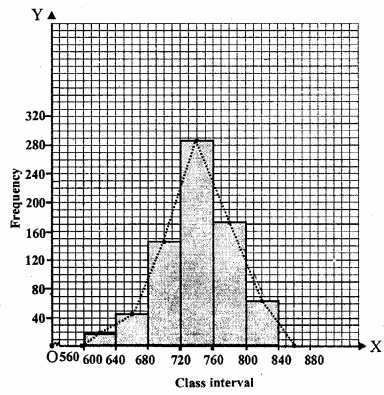
Question 11.
Solution:
We represent class interval on x-axis and frequency on y-axis. First we construct the histogram and then join the midpoints of the tops of each rectangle by line segments. We shall take two imagined class i.e. 560-600 at the beginning and 840-900 at the end. Join their midpoints also to complete
Question 12.
Solution:
We will take the imagined class 11-0 at the beginning and 61-70 at the end. Each with frequency zero. Thus, we have,
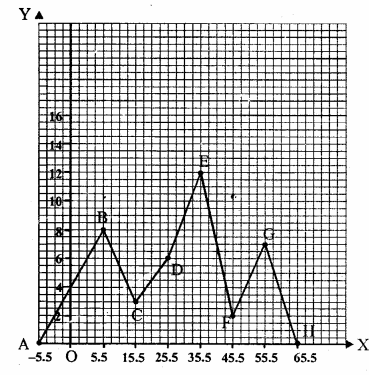
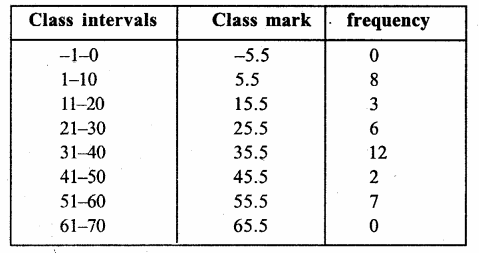
Now we will mark the points A (-5.5, 0), B(5.5, 8), C(15.5, 3) D(25.5, 6), E(35.5, 12), F(45.5, 2), G(55.5, 7) and H(65.5, 0) on the graph and join them in order to get the required frequency polygon.
Hope given RS Aggarwal Solutions Class 9 Chapter 14 Statistics Ex 14C are helpful to complete your math homework.
If you have any doubts, please comment below. Learn Insta try to provide online math tutoring for you.