RD Sharma Class 9 Solutions Chapter 23 Graphical Representation of Statistical Data Ex 23.3
These Solutions are part of RD Sharma Class 9 Solutions. Here we have given RD Sharma Class 9 Solutions Chapter 23 Graphical Representation of Statistical Data Ex 23.3
Other Exercises
- RD Sharma Class 9 Solutions Chapter 23 Graphical Representation of Statistical Data Ex 23.1
- RD Sharma Class 9 Solutions Chapter 23 Graphical Representation of Statistical Data Ex 23.2
- RD Sharma Class 9 Solutions Chapter 23 Graphical Representation of Statistical Data Ex 23.3
- RD Sharma Class 9 Solutions Chapter 23 Graphical Representation of Statistical Data MCQS
Question 1.
Construct a histogram for the following data:
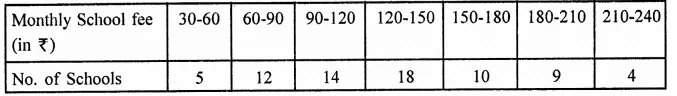
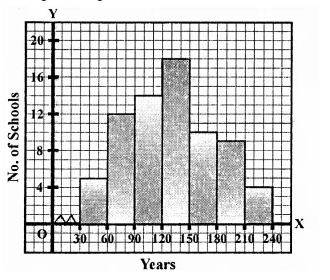
Solution:
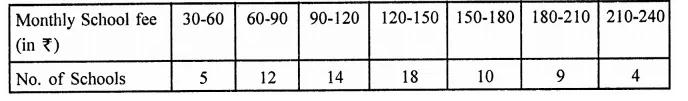
Histogram is given below:
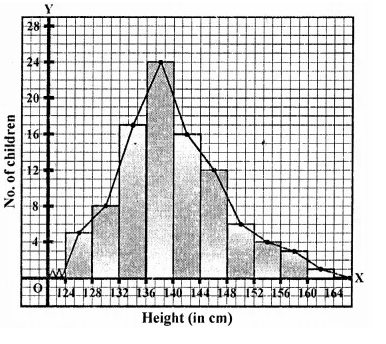
Question 2.
The distribution of heights (in cm) of 96 children is given below. Construct a histogram and a frequency polygon on the same axes.
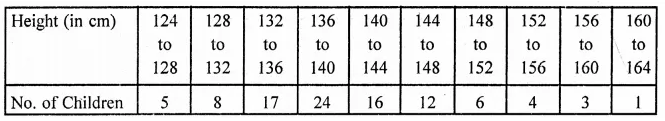
Solution:
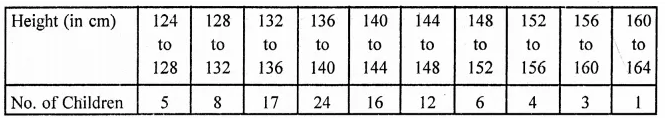
Histogram and frequency polygon is given here.
Draw midpoints Of each rectangle at the top and join them to get a frequency polygon.
Question 3.
The time taken, in seconds, to solve a problem by each of 25 pupils is as follows:
16, 20, 26, 27, 28, 30, 33, 37, 38, 40, 42, 43, 46, 46, 46, 48, 49, 50, 53, 58, 59, 60, 64, 52, 20
(a) Construct a frequency distribution for these data, using a class interval of 10 seconds.
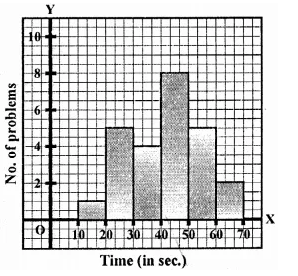
(b) Draw a histogram to represent the frequency distribution.
Solution:
Lowest observation = 16,
Highest observation = 64
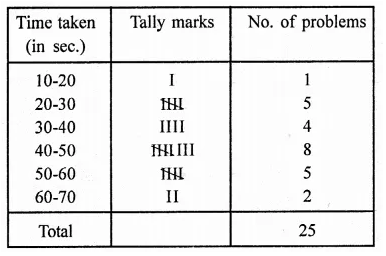
Below is given the histogram
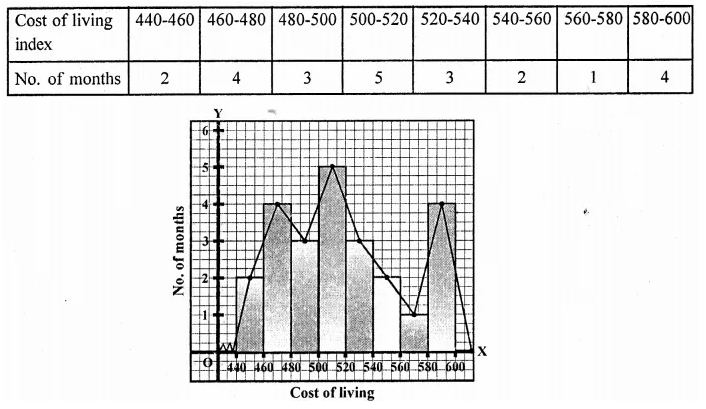
Question 4.
Draw, in the same diagram, a histogram and a frequency polygon to represent the following data which shows the monthly cost of living index of a city in a period of 2 years:
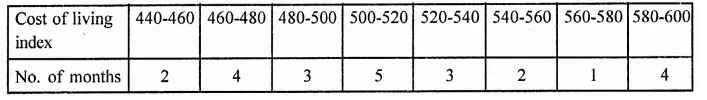
Solution:
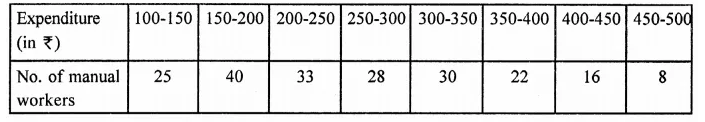
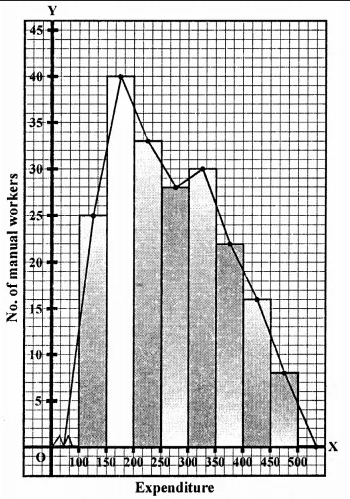
Question 5.
The following is the distribution of total household expenditure (in Rs.) of manual worker in a city:
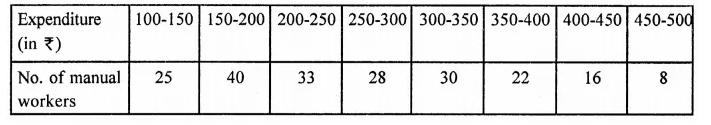
Draw a histogram and a frequency polygon representing the above data.
Solution:
Here is given histogram and frequency polygon.
Question 6.
The following table gives the distribution of IQ’s (intelligence quotients) of 60 pupils of class V in a school:
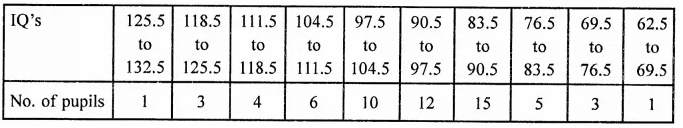
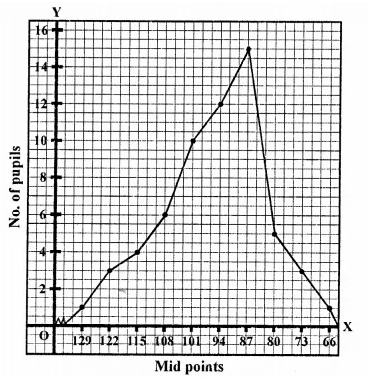
Draw a frequency polygon for the above data.
Solution:
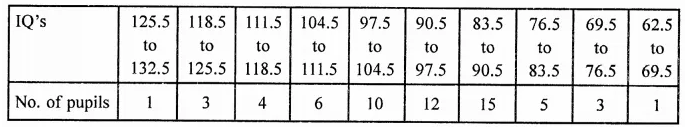
Now plot the (mid point, frequency) on the graph and join them to get a frequency polygon.
Question 7.
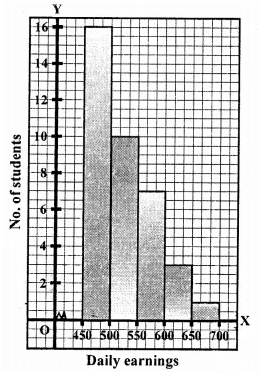
Draw a histogram for the daily earnings of 30 drug stores in the following table:
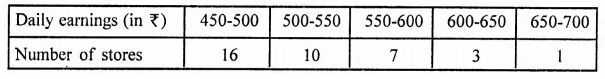
Solution:
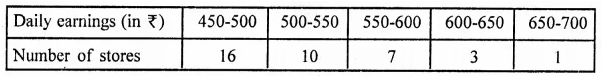
Hisotgram is given below:
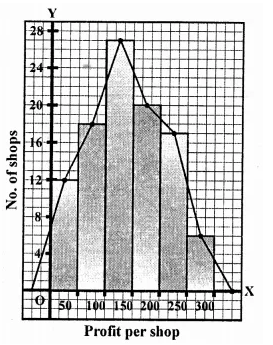
Question 8.
The monthly profits (in t) of 100 shops are distributed as follows:
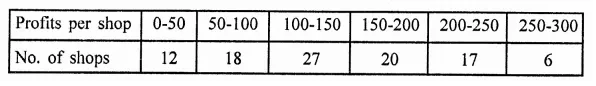
Draw a histogram for the data and show the frequency polygon for it.
Solution:
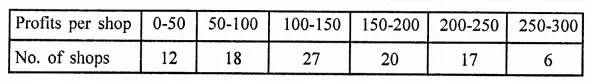
Histogram and frequency polygon is given below:
Hope given RD Sharma Class 9 Solutions Chapter 23 Graphical Representation of Statistical Data Ex 23.3 are helpful to complete your math homework.
If you have any doubts, please comment below. Learn Insta try to provide online math tutoring for you.