RD Sharma Class 9 Solutions Chapter 22 Tabular Representation of Statistical Data Ex 22.1
These Solutions are part of RD Sharma Class 9 Solutions. Here we have given RD Sharma Class 9 Solutions Chapter 22 Tabular Representation of Statistical Data Ex 22.1
Other Exercises
Question 1.
What do you understand by the word ‘statistics’ in (i) singular form, (ii) plural forms.
Solution:
The word ‘statistics’ is used in both its singular as well as its plural senses.
In singular sense, statistics piay be defined as the science of collection, presentation, analysis and interpretation of numerical data.
In plural sense, statistics means numerical facts or observations collected with definite purpose.
For example, income and expenditure of persons in a particular locality, number of males and females in a particular town are statistics.
Question 2.
Describe some fundamental characteristics of statistics.
Solution:
Statistics in plural sense have the following characteristics:
(i) A single observation does not form statistics. Statistics are a sum total of observations.
(ii) Statistics are expressed quantitatively and not qualitatively.
(iii) Statistics are collected with a definite purpose.
(iv) Statistics in an experiment are comparable and can be classified into various groups.
Question 3.
What are (i) primary data? (ii) secondary data? Which of the two – the primary or the secondary data – is more reliable and why?
Solution:
(i) Primary data : When an investigator collects the data himself with a definite plan Or design in his mind, it is called primary data.
(ii) Secondary data : Data which are not originally collected rather obtained from the published or unpublished, sources are called secondary data.
Primary data are reliable and relevent because they are original in character and are collected by some individuals or by some institutions or by research bodies.
Question 4.
Why do we group data?
Solution:
When the number of observations is large, then arranging data in ascending or descending order is tedius job and it does not tell us much except minimum or maximum(s) of data. So, to make it easily understandable and clear, we tabulate data in the form of a table.
Question 5.
Explain the meaning of the following terms:
(i) variate
(ii) class intervals
(iii) class size
(iv) class mark
(v) frequency
(vi) class limits
(vii) true class limits.
Solution:
(i) Variate : The observations of a data are called variate.
(ii) Class intervals : When the presentations of data in classes, or groups, then groups are called classes or class intervals.
(iii) Class size : The difference between upper limit and lower limit is called class size.
(iv) Class mark : The mean of lower limit and upper limit is called class mark or mid value. Therefore class mark
= \(\frac { lower limit + upper limit }{ 2 }\)
(v) Frequency : The number of times an observation occurs in the given data, is called frequency of that observation.
(vi) Class limits : Every class has two limits : lower limit and upper limit.
(vii) True class limits : Whenever inclusive method is used, it is necessary tp make an adjustment to determine the correct class intervals, and to have continuity. If a-b is a class in inclusive method, then in order to change it into exclusive method, it becomes
a – \(\frac { h }{ 2 }\) – b + \(\frac { h }{ 2 }\) where h = \(\frac { 1 }{ 2 }\) [lower limit of a class – upper limit of previous class]
Question 6.
The ages of ten students of a group are given below. The ages have been recorded in years and months.
8-6, 9-0, 8-4, 9-3, 7-8, 8-11, 8-7, 9-2, 7¬10, 8-8
(i) What is the lowest age?
(ii) What is the highest age?
(iii) Determine the range?
Solution:
From the given data
(i) Lowest age is 7 years 8 months
(ii) The highest age is 9 years, 3 months
(iii) Range = Highest term – Lowest term
= 9 years 3 months – 7 years 8 months
= 1 years 7 months
Question 7.
The monthly pocket money of six friends is given below:
₹45, ₹30, ₹40, ₹50, ₹25, ₹45
(i) What is the highest pocket money?
(ii) What is the lowest pocket money?
(iii) What is the range?
(iv) Arrange the amounts of pocket money in ascending order.
Solution:
From the given data
(i) Highest pocket money = ₹50
(ii) Lowest pocket money = ₹25
(iii) Range = Highest term – Lowest term = ₹50-₹25 = ₹25
(iv) In ascending order : ₹25, ₹30, ₹40, ₹45, ₹45, ₹50
Question 8.
Write the class-size in each of the following:
(i) 0-4,5-9,10-14
(ii) 10-19, 20-29, 30-39
(iii) 100-120, 120-140, 160-180
(iv) 0-0.25, 0.25-0.50, 0.50-0.75
(v) 5-5,01, 5.01-5.02, 5.02-5.03
Solution:
(i) In 0-4, 5-9, 10-14
0-4 means from 0 to 4, similarly 5-9 means 5 to 9 and 10-14 means 10 to 14
class-size is 5
(ii) In 10-19, 20-29, 30-39
Here 10-19, means 10 to 19, 20-29 means 20 to 29 and 30-39 means 30 to 39
Class-size = 10
(iii) 100-120, 120-140, 160-180
Here 100-120, 120-140, 160-180
Then 120 – 100 = 20, 140 – 120 = 20, 180 – 160 = 20 is class-size = 20
(iv) 0-0.25, 0.25-0.50, 0.50-0.75
Here 0.25 – 0 = 0.25, 0.50 – 0.25 = 0.25 and 0.75 – 0.50 = 0.25
∴ Class-size = 0.25
(v) 5-5.01, 5.01-5.02, 5.02-5.03
Here 5.01 – 5 = 0.01, 5.02 – 5.01 = 0.01 and 5.03 – 5.02 = 0.01
∴ Class-size = 0.01
Question 9.
The final marks in mathematics of 30 students are as follows:
53, 61, 48, 60, 78, 68, 55, 100, 67, 90
75, 88, 77, 37, 84, 58, 60, 48, 62, 56
44, 58, 52, 64, 98, 59, 70, 39, 50, 60
(i) Arrange these marks in the ascending order,30 to 39 one group, 40 to 49 second group, etc.
Now answer the following:
(ii) What is the highest score?
(iii) What is the lowest score?
(iv) What is the range?
(v) If 40 is the pass mark how many have failed?
(vi) How many have scored 75 or more?
(vii) Which observations between 50 and 60 have not actually appeared?
(viii)How many have scored less than 50?
Solution:
(i) Arranging in ascending order:
37, 39, 44, 48, 48, 50, 52, 53, 55, 56, 58, 58, 59, 60, 60, 60, 61, 62, 64, 67, 68, 70, 75, 77, 78, 84, 88, 90, 98, 100
(ii) Highest score =100
(iii) Lowest score = 37
(iv) Range = Highest score – Lowest score = 100 – 37 = 63
(v) If 40 is marks, then the number of students who failed = 2
(vi) No. of students who scored 75 or more = 8
(vii) Between 50 and 60, the scores which are missing 51, 54, 57
(viii) Number of students who scored less then 50 = 2 + 3 = 5
Question 10.
The weights of new born babies (in kg) in a hospital on a particular day are as follows:
2.3, 2.2, 2.1, 2.7, 2.6, 3.0, 2.5, 2.9, 2.8, 3.1, 2.5, 2.8, 2.7, 2.9, 2.4
(i) Rearrange the weights in descending order.
(ii) Determine the highest weight.
(iii) Determine the lowest weight.
(iv) Determine the range.
(v) How many babies were bom on that day?
(vi) How many babies weigh below 2.5 kg?
(vii) How many babies weigh more than 2.8 kg?
(viii)How many babies weigh 2.8 kg?
Solution:
(i) Weights in descending order are
3.1, 3.0, 2.9, 2.9, 2.8, 2.8, 2.7, 2.7, 2.6, 2.5, 2.5, 2.4, 2.3, 2.2, 2.1
(ii) Highest weight = 3.1
(iii) Lowest weight = 2.1
(iv) Range = Highest weight – Lowest wight = 3.1 – 2.1 = 1.0
(v) No. of babies who bom = 15
(vi) No. of babies whose weights are below 2.5 kg = 4
(vii) No. of babies whose weight are more than 2.8 kg = 4.
(viii) No. of babies whose weight is 2.8 kg = 2
Question 11.
The number of runs scored by a cricket player in 25 innings are as follows:
26, 35, 94, 48, 82, 105, 53, 0, 39, 42, 71, 0, 64, 15, 34, 67, 0, 42, 124, 84, 54, 48, 139, 64, 47.
(i) Rearrange these runs in ascending order.
(ii) Determine the player, is highest score.
(ii) How many times did the player not score a run?
(iv) How many centuries did he score?
(v) How many times did he score more than 50 runs?
Solution:
(i) Arranging in ascending order
0, 0, 0, 15, 26, 34, 35, 39, 42, 42, 47, 48, 48, 53, 54, 64, 64, 67, 71, 82, 84, 94, 105, 124, 139
(ii) Highest score is 139
(iii) 3 times when his score is 0
(iv) No. of times, he made century = 3
(v) No. of times his score more then 50 runs = 12
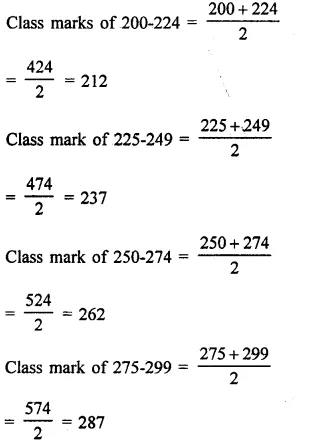
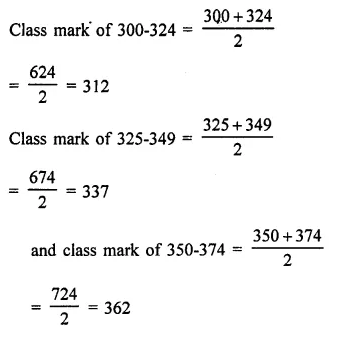
Question 12.
The class size of a distribution is 25 and the first class-interval is 200-224. There are seven class-intervals.
(i) Write the class-intervals.
(ii) Write the class-marks of each interval
Solution:
Class size = 25
First class is 200-224
∴ Number of class = 7
∴ Class interval will be
(i) 200-224, 225-249, 250-274, 275-299, 300-324, 325-349, 350-374
Question 13.
Write the class size and class limits in each of the following:
(i) 104, 114, 124, 134, 144, 154 and 164
(ii) 47, 52, 57, 62, 67, 72, 77, 82, 87, 92, 97 and 102
(iii) 12.5, 17.5, 22.5, 27.5, 32.5, 37.5, 42.5, 47.5
Solution:
(i) 104, 114, 124, 134, 144, 154 and 164
Here class size = 114 – 104 = 10
Here in first class, 104 – \(\frac { 10 }{ 2 }\)
= 104 – 5 = 99 and 104 + 5 = 109
∴ Class will be 99-109
In this way other classes will be 109-119, 119-129, 129-139, 139-149, 149-159, 159¬169
(ii) In 47, 52, 57, 62, 67, 72, 77, 82, 87, 92, 97, 102
Here class size = 52 – 47 = 5
∴ In first class, 47 – \(\frac { 5 }{ 2 }\) and 47 + \(\frac { 5 }{ 2 }\)
= 44.5-49.5
In this way other classes will be = 49.5-54.5, 54.5-59.5, 59.5-64.5, 64.5-69.5,69.5-74.5, 74.5-79.5, 79.5-84.5, 84.5-89.5, 89.5-94.5,94.5-99.5, 99.5-104.5 070 12.5, 17.5, 22.5, 27.5, 32.5, 37.5, 42.5, 47.5
Here class interval (size) = 17.5 – 12.5 = 5
In the class = 12.5 – \(\frac { 5 }{ 2 }\) , 12.5 + \(\frac { 5 }{ 2 }\)
⇒ 12.5 – 2.5, 12.5 + 2.5
⇒ 10, 15
∴ First class will be 10-15
In this way other classes 15-20, 20-25, 25-30, 30-35, 35-40, 40-45, 45-50
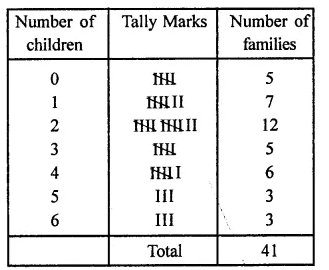
Question 14.
Following data gives the number of children in 41 families:
1, 2, 6, 5, 1, 5, 1, 3, 2, 6, 2, 3, 4, 2, 0, 0, 4, 4, 3, 2, 2, 0, 0, 1, 2, 2, 4, 3, 2, 1, 0, 5, 1, 2, 4, 3, 4, 1, 6, 2, 2.
Represent it in the form of a frequency distribution.
Solution:
Frequency distribution table is given below:
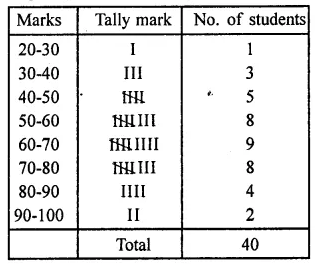
Question 15.
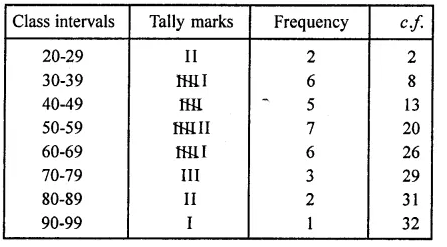
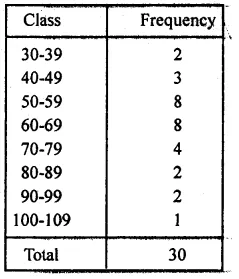
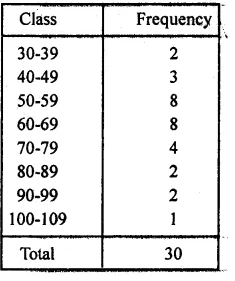
The marks scored by 40 students of class IX in mathematics are given below:
81, 55, 68, 79, 85, 43, 29, 68, 54, 73, 47, 35, 72, 64, 95, 44, 50, 77, 64, 35, 79, 52, 45, 54, 70, 83, 62, 64, 72, 92, 84, 76, 63, 43, 54, 38, 73, 68, 52, 54.
Prepare a frequency distribution with class size of 10 marks.
Solution:
Maximum marks = 95,
minimum marks = 29,
range = 95 – 29 = 66
Frequency distribution is given below
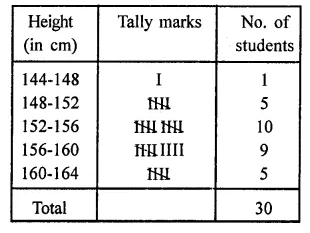
Question 16.
The heights (in cm) of 30 students of class IX are given below:155, 158, 154, 158, 160, 148, 149, 150, 153, 159, 161, 148, 157, 153, 157, 162, 159, 151, 154, 156, 152, 156, 160, 152, 147, 155, 163, 155, 157, 153.
Prepare a frequency distribution table with 160-164 as one of the class intervals.
Solution:
Maximum height = 163 cm,
minimum height = 147 cm,
range 163 – 147 = 16
Frequency distribution of the given data is given below
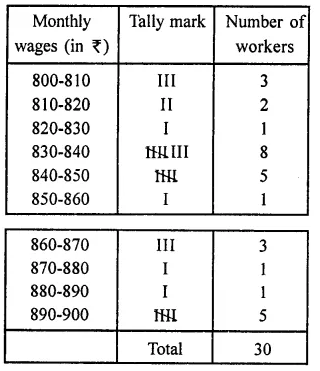
Question 17.
The monthly wages of 30 workers in a factory are given below:
830, 835, 890, 810, 835, 836, 869, 845, 898, 890, 820, 860, 832, 833, 855, 845, 804, 808, 812, 840, 885, 835, 836, 878,840, 868, 890, 806, 840, 890.
Represent the data in the form of a frequency distribution with class size 10.
Solution:
Highest wage = ₹890,
lower wage = ₹804,
range = 890 – 804 = 86
Frequency distribution table is given below
Question 18.
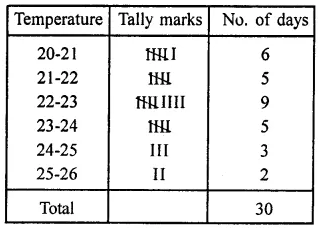
The daily maximum temperatures (in degree Celsius) recorded in a certain city during the month of November are as follows:
25.8, 24.5, 25.6, 20.7, 21.8, 20.5, 20.6, 20.9, 22.3, 22.7, 23.1, 22.8, 22.9, 21.7, 21.3, 20.5, 20.9, 23.1, 22.4, 21.5, 22.7, 22.8, 22.0, 23.9, 24.7, 22.8, 23.8, 24.6, 23.9, 21.1
Represent them as a frequency distribution table with class size 1°C.
Solution:
Maximum temperature = 25.8
Minimum temperature = 20.5
Range = 25.8 – 20.5 = 5.3
Frequency distribution table is given below:
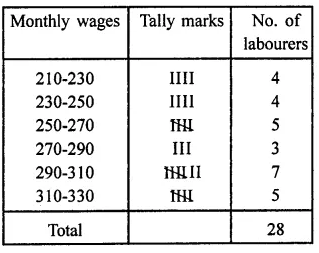
Question 19.
Construct a frequency table with equal class intervals from the following data on the monthly wages (in rupees) of 28 labourers working in a factory, taking* one of the class intervals as 210-230 (230 not included):
220, 268, 258, 242, 210, 268, 272, 242, 311, 290, 300, 320, 319, 304, 302, 318, 306, 292, 254, 278, 210, 240, 280, 316, 306, 215, 256, 236.
Solution:
Maximum wages = ₹320
Minimum wages = ₹210
Range = 320 – 210 = 110
Required frequency table is given below:
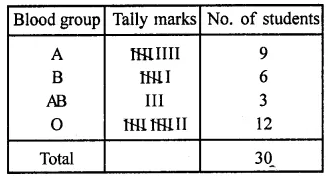
Question 20.
The blood groups of 30 students of class VIII are recorded as follows:
A, B, O, O, AB, O, A, O, B, A, O, B, A, O, O, A, AB, O, A, A, O, O, AB, B, A, O, B, A, B, O
Represent this data in the form of a frequency distribution table. Find out which is the most common and which is the rarest blood group among these students. (NCERT)
Solution:
Frequency distribution table is given below:
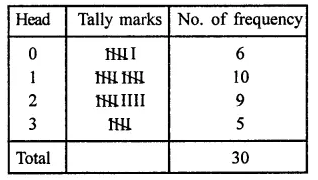
Question 21.
Three coins were tossed 30 times. Each time the number of heads occuring was noted down as follow:
0 1 2 2 1 2 3 1 3 0
1 3 1 1 2 2 0 1 2 1
3 0 0 1 1 2 3 2 2 0
Prepare a frequency distribution table for the data given above. (NCERT)
Solution:
Frequency distribution table is given below:
Question 22.
Thirty children were asked about the number of hours they watched T.V. programmes in the previous week. The results were found as follows:
1 6 2 35 12 5 8 4 8
10 3 4 12 2 8 15 1 17 6
3 2 8 5 9 6 8 7 14 12
(i) Make a grouped frequency distribution table for this data, taking class width 5 and one of the class intervals as 5-10.
(ii) How many children watched television for 15 or more hours a week? (NCERT)
Solution:
Highest number of hours = 17
Lowest number of hours = 1
(i) The frequency table is given below:
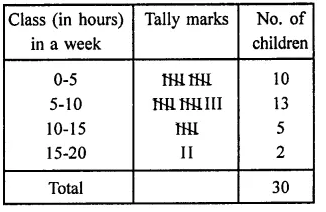
(ii) No. of children watching T.V. for 15 or more hours a week = 2
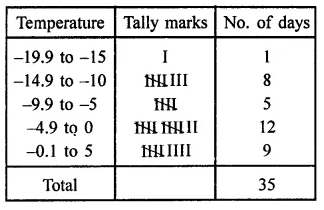
Question 23.
The daily minimum temperatures in degrees Celsius recorded in a certain Arctic region are as follows:
-12.5, -10.8, -18.6, -8.4, -10.8, -4.2, -4.8, -6.7, -13.2, -11.8, -2.3, 1.2, 2.6, 0, 2.4, 0, 3.2, 2.7, 3.4, 0, -2.4, -2.4, 0, 3.2, 2.7, 3.4, 0, -2.4, -5.8, -8.9, -14.6, -12.3, -11.5,-7.8,-2.9.
Represent them as frequency distribution table taking -19.9 to -15 as the first class interval.
Solution:
Maximum temperature = -18.6
Minimum temperature = 3.4
Range = 3.4 – (-18.6) = 3.4 + 18.6 = 22
The required frequency distribution table is given below:
Hope given RD Sharma Class 9 Solutions Chapter 22 Tabular Representation of Statistical Data Ex 22.1 are helpful to complete your math homework.
If you have any doubts, please comment below. Learn Insta try to provide online math tutoring for you.