RS Aggarwal Class 8 Solutions Chapter 25 Graphs Ex 25C

RS Aggarwal Class 8 Solutions Chapter 25 Graphs Ex 25C

These Solutions are part of RS Aggarwal Solutions Class 8. Here we have given RS Aggarwal Solutions Class 8 Chapter 25 Graphs Ex 25C.

Other Exercises

OBJECTIVE QUESTIONS
Tick the correct answer in each of the following:

Question 1.
Solution:
Answer = (a)
∵ In point (3, 6), both x and y are positive.

Question 2.
Solution:
Answer = (c)
∵ In point ( – 7, – 1) both x and y are negative.

Question 3.
Solution:
Answer = (d)
∵ In point (2, – 3), x is positive and y is negative.

Question 4.
Solution:
Answer = (b)
∵ In point ( – 4, 1), x is negative and y is positive.

Question 5.
Solution:
Answer = (c)
∵ Abscissa is distance of a point from y- axis

Question 6.
Solution:
Answer = (d)
y = a is a line parallel to x-axis at a distance of ‘a’ units.

Question 7.
Solution:
Answer = (a)
The equation of the line y-axis, is x = 0

Hope given RS Aggarwal Solutions Class 8 Chapter 25 Graphs Ex 25C are helpful to complete your math homework.

If you have any doubts, please comment below. Learn Insta try to provide online math tutoring for you.

RS Aggarwal Class 8 Solutions Chapter 25 Graphs Ex 25B

RS Aggarwal Class 8 Solutions Chapter 25 Graphs Ex 25B

These Solutions are part of RS Aggarwal Solutions Class 8. Here we have given RS Aggarwal Solutions Class 8 Chapter 25 Graphs Ex 25B.

Other Exercises

Question 1.
Solution:
(a) y = 3x
By giving some different values to x, we shall get corresponding values of y.
x = 1 then y = 3 x 1 = 3
if x = 2, then y = 3 x 2 = 6
if x = 0, then y = 3 x 0 = 0
RS Aggarwal Class 8 Solutions Chapter 25 Graphs Ex 25B 1.1
Now plotting the points given above, and joining them.
(b) We get a line, From the graph.
(i) When x = 3, then y = 9
(ii) When x = 5, then y = 15
(iii) When x = 6, then y = 18 Ans.
RS Aggarwal Class 8 Solutions Chapter 25 Graphs Ex 25B 1.2

Question 2.
Solution:
(a) P = 4x
By giving some different values to x, we get the corresponding values of y or P
If x = 1, then P = 4 x 1 = 4
if x = 2, then P = 4 x 2 = 8
if x = 0, then P = 4 x 0 = 0
RS Aggarwal Class 8 Solutions Chapter 25 Graphs Ex 25B 2.1
Plot the points (1, 4), (2, 8) and 0, 0) on the graph and join then to get the graph of P = 4x as shown
(b) From the graph we see that
(i) When x = 3, then P = 12
(ii) When x = 4, then P = 16
(iii) When x = 6, then P = 24 Ans.
RS Aggarwal Class 8 Solutions Chapter 25 Graphs Ex 25B 2.2

Question 3.
Solution:
A = x²
giving some values to x, we get corresponding values of y or A
If x = 1, then y or A = (1)² = 1
If x = 2, then y or A = (2)² = 4
If x = 0, then y or A = (0)² = 0
RS Aggarwal Class 8 Solutions Chapter 25 Graphs Ex 25B 3.1
Now plot the point (1, 1), (2, 4), (0, 0) on the graph, and join them to get the graph of A = x2 as shown
RS Aggarwal Class 8 Solutions Chapter 25 Graphs Ex 25B 3.2
(b) From the graph we see that
(i) When x = 2, then A = 4
(ii) When x = 3, then A = 9
(ii) When x = 4 then A = 16 Ans.

Hope given RS Aggarwal Solutions Class 8 Chapter 25 Graphs Ex 25B are helpful to complete your math homework.

If you have any doubts, please comment below. Learn Insta try to provide online math tutoring for you.

RS Aggarwal Class 8 Solutions Chapter 25 Graphs Ex 25A

RS Aggarwal Class 8 Solutions Chapter 25 Graphs Ex 25A

These Solutions are part of RS Aggarwal Solutions Class 8. Here we have given RS Aggarwal Solutions Class 8 Chapter 25 Graphs Ex 25A.

Other Exercises

Question 1.
Solution:
Below is given the graph in which X’OX and YOY’ are the co-ordinate axes intersecting each other at O. Now the. points given have been plotted as shown on the graph.
RS Aggarwal Class 8 Solutions Chapter 25 Graphs Ex 25A 1.1


Hope given RS Aggarwal Solutions Class 8 Chapter 25 Graphs Ex 25A are helpful to complete your math homework.

If you have any doubts, please comment below. Learn Insta try to provide online math tutoring for you.

RD Sharma Class 9 Solutions Chapter 22 Tabular Representation of Statistical Data MCQS

RD Sharma Class 9 Solutions Chapter 22 Tabular Representation of Statistical Data MCQS

These Solutions are part of RD Sharma Class 9 Solutions. Here we have given RD Sharma Class 9 Solutions Chapter 22 Tabular Representation of Statistical Data MCQS

Other Exercises

Mark the correct alternative in each of the following:
Question 1.
Tally marks are used to find
(a) class intervals
(b) range
(c) frequency
(d) upper limits
Solution:
Frequency (c)

Question 2.
The difference between the highest and lowest values of the observations is called
(a) frequency
(b) mean
(c) range
(d) class intervals
Solution:
range (c)

Question 3.
The difference between the upper limit and the lower class limits is called
(a) mid-points
(b) class size
(c) frequency
(d) mean
Solution:
class size (b)

Question 4.
In the class intervals 10-20, 20-30, 20 is taken in
(a) the interval 10-20
(b) the interval 20-30
(c) both interval 10-20, 20-30
(d) none of the intervals
Solution:
the interval 20-30 (b)

Question 5.
In a frequency distribution, the mid value of a class is 15 and the class intervals is 4. The lower limit of the class is
(a) 10
(b) 12
(c) 13
(d) 14
Solution:
Mid value = 15 and class interval is 4
∴ Lower limit = 15 – \(\frac { 4 }{ 5 }\) = 15 – 2 = 13 (c)

Question 6.
The mid-value of a class interval is 42. If the class size is 10, then the upper and lower limits of the class are
(a) 47 and 37
(b) 37 and 47
(c) 37.5 and 47.5
(d) 47.5 and 37.5
Solution:
Mid value = 42 and class size =10
∴ Upper limit = 42 + \(\frac { 10 }{ 2 }\) = 42 + 5 = 47
and lower limit = 42 – \(\frac { 10 }{ 2 }\) = 42 – 5 = 37
Upper class limit and lower class limits are 47, 37 (a)

Question 7.
The number of times a particular item occurs in a given data is called its
(a) variation
(b) frequency
(c) cumulative frequency
(d) class-size
Solution:
frequency (b)

Question 8.
The width of each of nine classes in a frequency distribution is 2.5 and the lower class boundary of the lowest class 10.6. Then the upper class boundary of the highest class is
(a) 35.6
(b) 33.1
(c) 30.6
(d) 28.1
Solution:
Width of each class = 2.5
No. of classes = 9
Lower class boundary of the lowest class = 10.6
∴ Upper class limit of highest class = 10.6 + 9 x 2.5
= 10.6 + 22.5 = 33.1 (b)

Question 9.
The following marks were obtained by the students in a test:
81, 72, 90, 90, 86, 85, 92, 70, 71, 83, 89, 95, 85, 79, 62
The range of the marks is
(a) 9
(b) 17
(c) 27
(d) 33
Solution:
Marks are 81, 72, 90, 90, 86, 85, 92, 70, 71, 83, 89, 95, 85, 79, 62
Here highest marks = 95
and lowest marks = 62
∴ Range = highest marks – lowest marks = 95 – 62 = 33 (d)

Question 10.
Tallys are usually marked in a bunch of
(a) 3
(b) 4
(c) 5
(d) 6
Solution:
4 i.e. IIII (b)

Question 11.
Let l be the lower class limit of a class- interval in a frequency distribution and m be the mid-point of the class. Then, the upper class limit of the class is
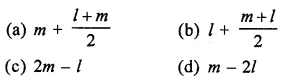
RD Sharma Class 9 Solutions Chapter 22 Tabular Representation of Statistical Data MCQS 11.1
Solution:
l is the lower class limit of a class interval
m is the mid point of the class
m = \(\frac { u+l }{ 2 }\)
⇒ 2m = u+ l ⇒ u = 2m – l
Then, upper class limit = 2 m – l (c)

Hope given RD Sharma Class 9 Solutions Chapter 22 Tabular Representation of Statistical Data MCQS are helpful to complete your math homework.

If you have any doubts, please comment below. Learn Insta try to provide online math tutoring for you.

RS Aggarwal Class 8 Solutions Chapter 24 Probability Ex 24B

RS Aggarwal Class 8 Solutions Chapter 24 Probability Ex 24B

These Solutions are part of RS Aggarwal Solutions Class 8. Here we have given RS Aggarwal Solutions Class 8 Chapter 24 Probability Ex 24B.

Other Exercises

Tick the correct answer in each of the following :

Question 1.
Solution:
A spinning wheel has 3 white and 5 green sectors
Possible out come = 3 + 5 = 8
It is spinners, then
Probability of getting a green sector = \(\\ \frac { 5 }{ 8 } \) (b)

Question 2.
Solution:
8 cards are numbered 1, 2, 3, 4, 5, 6, 7, 8
They are mixed and kept in a box One card is chosen at random, then Probability of card having 9 number less than 4 = \(\\ \frac { 3 }{ 8 } \) (c)

Question 3.
Solution:
Two coins are tossed simultaneously, then Possible outcomes = 4
Now probability of getting one head and one tail = \(\\ \frac { 2 }{ 4 } \) = \(\\ \frac { 1 }{ 2 } \) (b)

Question 4.
Solution:
. In a bag, there are 3 white and 2 red balls
Possible outcomes = 3 + 2 = 5
Now probability of a red ball drawn
= \(\\ \frac { 2 }{ 5 } \) (d)

Question 5.
Solution:
A die is thrown then
Possible outcomes = 6
Now probability of getting 6 is \(\\ \frac { 1 }{ 6 } \) (b)

Question 6.
Solution:
A die is thrown
Possible outcomes = 6
Now probability of getting an even number
which are 2, 4, 6 = \(\\ \frac { 3 }{ 6 } \) = \(\\ \frac { 1 }{ 2 } \) (a)

Question 7.
Solution:
One card is drawn from a well shuffled deck of 52 cards, possible out comes = 52
The probability of card which is a queen = \(\\ \frac { 4 }{ 52 } \)
= \(\\ \frac { 1 }{ 13 } \) (c)

Question 8.
Solution:
One card is drawn from a well-shuffled deck of 52 card, possible out comes = 52 Probability of a card being a black 6
(which are two) = \(\\ \frac { 2 }{ 52 } \) = \(\\ \frac { 1 }{ 26 } \) (b)

Hope given RS Aggarwal Solutions Class 8 Chapter 24 Probability Ex 24B are helpful to complete your math homework.

If you have any doubts, please comment below. Learn Insta try to provide online math tutoring for you.