Selina Concise Mathematics Class 10 ICSE Solutions Chapter 24 Measures of Central Tendency (Mean, Median, Quartiles and Mode) Ex 24E
These Solutions are part of Selina Concise Mathematics Class 10 ICSE Solutions. Here we have given Chapter 24 Measures of Central Tendency (Mean, Median, Quartiles and Mode) Ex 24E.
Other Exercises
- Selina Concise Mathematics Class 10 ICSE Solutions Chapter 24 Measures of Central Tendency Ex 24A
- Selina Concise Mathematics Class 10 ICSE Solutions Chapter 24 Measures of Central Tendency Ex 24B
- Selina Concise Mathematics Class 10 ICSE Solutions Chapter 24 Measures of Central Tendency Ex 24C
- Selina Concise Mathematics Class 10 ICSE Solutions Chapter 24 Measures of Central Tendency Ex 24D
- Selina Concise Mathematics Class 10 ICSE Solutions Chapter 24 Measures of Central Tendency Ex 24E
Question 1.
The following distribution represents the height of 160 students of a school

Draw an ogive for the given distribution taking 2 cm = 5 cm of height on one axis and 2 cm = 20 students on the other axis. Using the graph, determine :
(i) The median height.
(ii) The inter quartile range.
(iii) The number of students whose height is above 172 cm
Solution:
The cumulative frequency table may be prepared as follows :
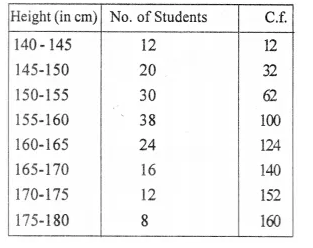
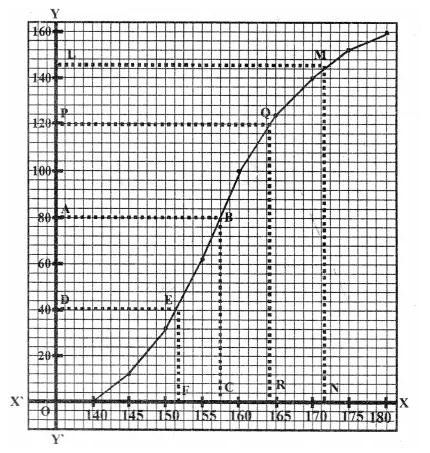
Now, we take height along x-axis and number of students along the y-axis. Now, plot the point (145, 12), (150, 32), (155, 62), (160, 100), (165, 124), (170, 140), (175, 152) and (180, 160). On the graph paper and join them with free hand.
(i) Here N = 160 ⇒ \(\frac { N }{ 2 }\) = 80
Which is even now take a point A on the y-axis representing 80. Through A draw horizontal line meeting the ogive at B. From B, draw BC ⊥ x-axis, meeting the x-axis at C.
The abscissa of C is 157.5 So, median = 157.5 cm
(ii) Proceeding in the same way as we have done in above, we have, Q1 = 152 and Q3 = 164
So, inter quartile range = Q3 – Q1 = 164 – 152 = 12 cm
(iii) From the ogive, we see that the number of students whose height is less than 172 is 145.
No. of students whose height is above 172 cm = 160 – 145 = 15
Question 2.
The following table gives the weekly wages of workers in a factory.

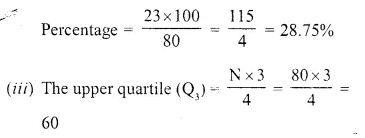
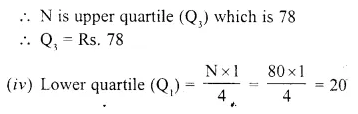
Calculate : (i) the mean, (ii) the modal class, (iii) the number of workers getting weekly w ages below Rs. 80 and (iv) the number of workers get¬ting Rs 65 or more but less than Rs. 85 as weekly wages. [2002]
Solution:
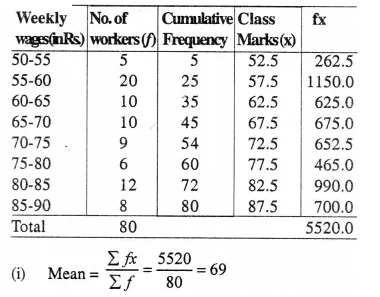
(ii) Modal class 55-60 (It has maximum frequency)
(iii) No. of workers getting wages below Rs. 80 = 60
(iv) No. of worker getting Rs. 65 is more but less than 85 as weekly wages = 37
Question 3.
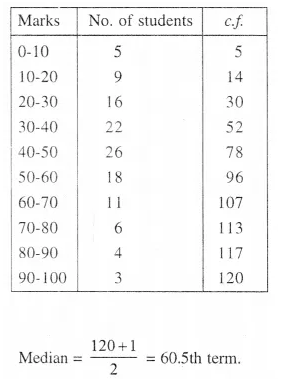
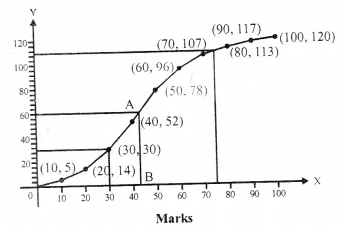
Draw an ogive for the data given below and from the graph determine :
(i) the median marks,
(ii) the number of students who obtained more than 75% marks ?
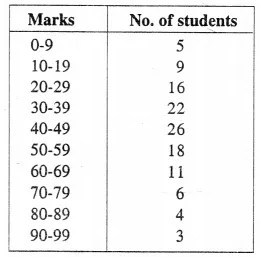
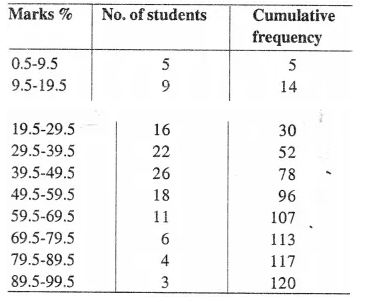
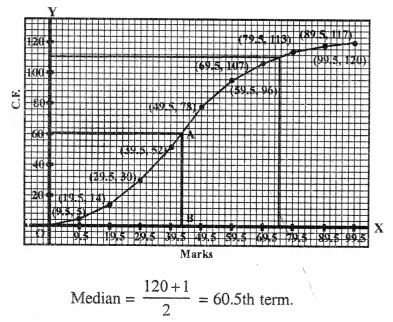
Through 60.5 th marks, draw a line segment parallel to x-axis which meets the curve at A.
From A, draw a line segment perpendicular to, x-axis meeting at B.
∴ B is the median = 43 (approx.)
No. of students who obtained upto 75% marks in the test =111
∴ No. of students who obtained more than 75% = 120- 111 =9
Question 4.
The mean of 1, 7, 5, 3, 4, and 4 is m. The numbers 3,2,4,2,3,3 and p have mean m-1 and median q. Find p and q.
Solution:
Mean of 1,7, 5, 3,4, and 4 = \(\frac { 24 }{ 6 }\) =4
∴ m = 4.
Now mean of 3,2,4,2,3,3 and p = m- 1= 4- 1 = 3
i.e. 17+p = 3xn when n =7
17 + p = 3×7 = 21
⇒ p = 21 – 17 = 4
Median of 3, 2,4,2, 3, 3 and 3 is q
Arranging in ascending order, 2,2, 3,3,3,3,4,4
Mean = 4th terms is 3.
∴ q = 3
P.Q.
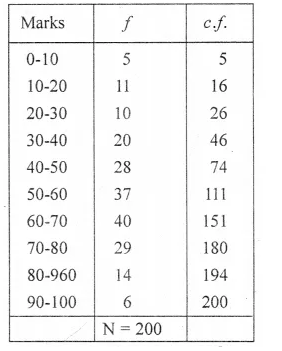
The marks of 200 students in a test were recorded as follows :
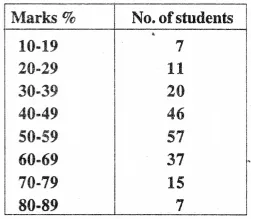
Construct the cumulative frequency table. Draw an ogive and use it to find :
(i) the median and
(ii) the number of students who score more than 35 % marks.
Solution:
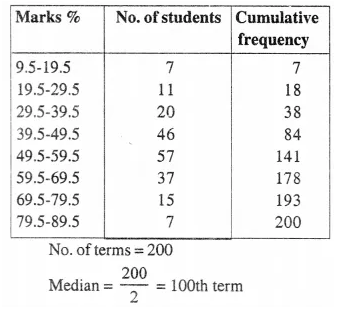
Through 100 th scores, draw a line segment parallel to x-axis which meets the curve at A. From A, draw a line segment perpendicular to it which meets at B.
∴ Median = 52.5
No. of students who score more than 35% marks.
= 200 – 28 = 172
Question 5.
In a malaria epidemic, the number of cases diagnosed were as follows :
Date (July) 1 2 3 4 5 6 7 8 9 10 11 12 Number 5 12 20 27 46 30 31 18 11 5 0 1 On what days does the mode, the upper and lower quartiles occur ?
Solution:
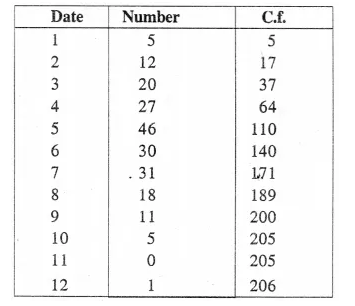
(i) Mode = 5th July (because it has the maximum frequencies i,e. 46)
Question 6.
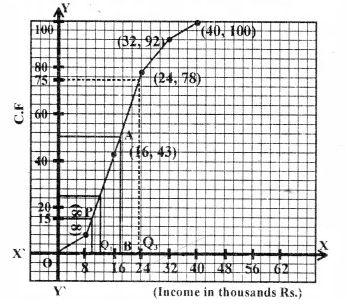
The incomes of the parents of 100 students in a class in a certain university are tabulated below :
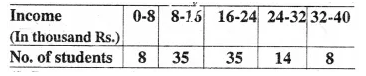
(i) Draw a cumulative frequency curve to estimate the median income.
(ii) If 15 % of the students ae given freeships on the basis of the income of their parents, find the annual income of parents, below which the freeships will be awarded.
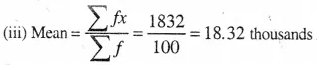
(iii) Calculate the Arithmetic mean.
Solution:
(Cummulative Frequancy table)
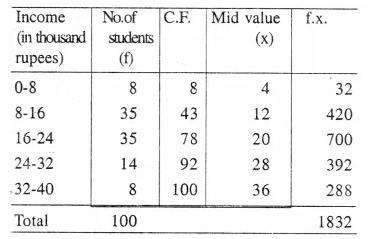
(i) No. of terms= 100
∴ Mean = \(\frac { 100 }{ 2 }\) = 50th term
Through 50 mark, draw a line segment parallel to x-axis which meets the curve at A. From A, draw a perpendicular to x-axis meeting it at B, B is the median.
∴ B = 17.6 thousands
(ii) Upper quartile = 100 x \(\frac { 3 }{ 4 }\) = 75th term
From the Curve Q3 = 23.2
(iii) Lower-quartile = 100 x \(\frac { 1 }{ 4 }\)=25th term
From the curve Q1 = 12.8
∴ Inter-quartile range = Q3– Q1 = 23.2 – 12.8
= 10.4 thousands
(iv) 15% of 100 students = \(\frac { 100 x 15 }{ 100 }\) = 15
From C.F. 15, draw a horizontal line which intersects the curve at P. From P, draw a perpendicular to x-axis meeting it at 11.2
∴ Freeship to parents = Rs. 11.2 thousands upto
the income of Rs. 11.2 thousands
Question 7.
The marks of 20 students in a test were as follows : 2, 6, 8, 9, 10, 11, 11, 12, 13, 13, 14, 14, 15, 15, 15, 16, 16, 18, 19 and 20. Calculate-
(i) the mean
(ii) the median
(iii) the mode. [2002]
Solution:
Arranging in ascending order,
2, 6, 8, 9, 10, 11, 11, 12, 13, 13, 14, 14, 15, 15, 15, 15, 16, 16, 18, 19, 20
No. of terms = 20
Ix = 2 + 6 + 8 + 9+ 10+ 11 + 11 + 12+ 13 + 13 + 14 + 14 + 14 + 15 + 15 + 15 + 16 + 16 + 18 +
19 + 20 = 257
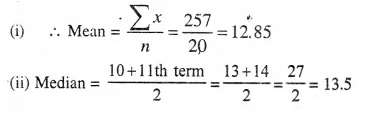
(iii) Mode = 15 (as it has maximum frequency i.e. it has 3)
Question 8.
The marks obtained by 120 students in a Mathematics test are given below:
Draw an ogive for the given distribution on a graph sheet. Use a suitable scale for your ogive. Use your ogive to estimate :
(i) the median
(ii) the number of students who obtained more than 75% marks in a test ?
(iii) the number of students who did not pass in the test if the pass percentage was 40. [2002]
(iv) the lower quartile
Solution:
Lower Quartile (Q1)
∴ \(\frac { N }{ 4 }\) = \(\frac { 120 }{ 4 }\) = 30
From a point B (30) on v-axis, draw a line parallel to x- axis meeting the curve at Q and from Q Draw a line parallel to .Y-axis meeting it at 30.
∴ Lower quartile = 30
Through 60.5th marks, draw a line segment parallel to x-axis which meets the curve at A. From A, draw a line segment perpendicular to, x-axis meeting at B.
∴ B is the median = 43 (approx.)
No. of students who obtained upto 75% marks in the test = 110
∴ No. of students who obtained more than 75% = 120- 110 = 10
No. of students who obtained less than 40% marks in the test = 52 (∴ in the graph x = 40, y = 52)
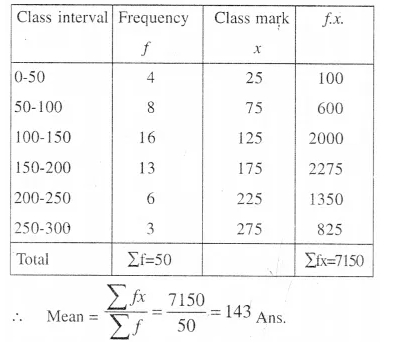
P.Q.
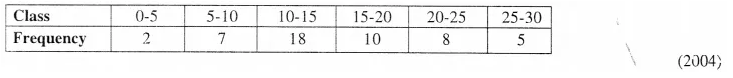
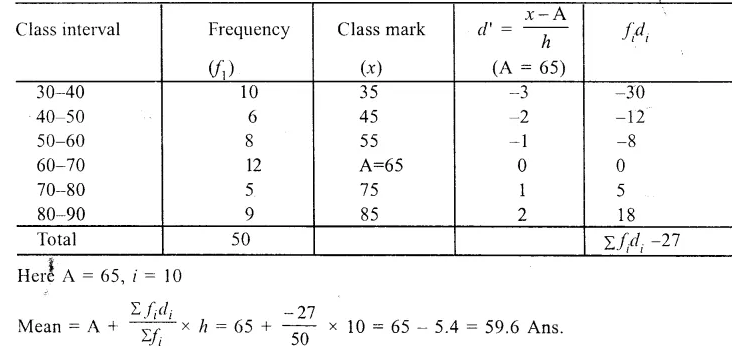
Find the mean for the following frequency distribution: [2003]
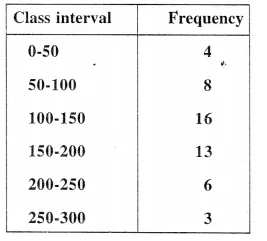
Solution:
P.Q.
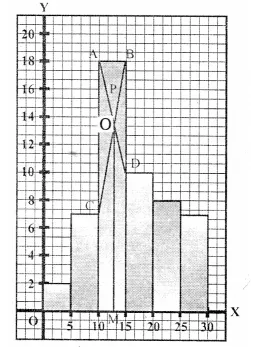
Draw a histogram and hence estimate the mode for the following frequency distribution: [2003]
Solution:
(i) Draw the histogram.
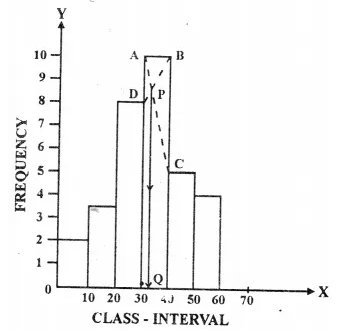
(ii) In the highest rectangle which represents the modal class draw two lines points AC and BD intersecting at P.
(iii) From P, draw a perpendicular to x-axis meeting at Q.
(iv) value of Q is the mode which is = 23
P.Q.
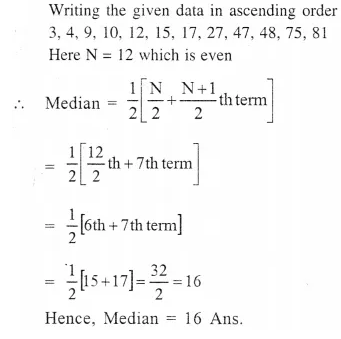
For die following set of data find the median :
10, 75, 3, 81, 17, 27, 4, 48, 12, 47, 9 and 15.
Solution:
P.Q.
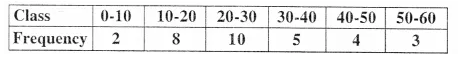
For the following frequency distribution draw a histogram. Hence, calculate the mode.
Solution:
Histogram :
(i) Draw a histogram and make the upper corner of the rectangle
(ii) With maximum frequency A and B. Also upper corners of the two other rectangles as C and D which are the next and to maximum rectangle.
(iii) Join AD and BC which intersect at P.
(iv) From P, draw PM ⊥ X – axis
OM = 13
Hence mode = 13
Question 9.
Using a graph paper, draw an Ogive for the following distribution which shows a record of the weight in kilograms of 200 students.

Use your Ogive to estimate the following :
(i) The percentage of students weighing 55 kg or more,
(ii) The weight above which the heaviest 30% of the students fall.
(iii) The number of students who are (a) under-weight and (b) over-weight, if 55.70 kg is considered as standard weight. (2005)
Solution:
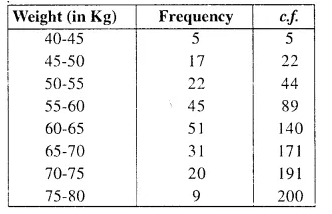
Plot the points (45. 5), (50, 22), (55, 44). (60, 89), (65, 140), (70, 171), (75, 191) and (80, 200) on the graph and join them in free hand to get an ogive as shown.
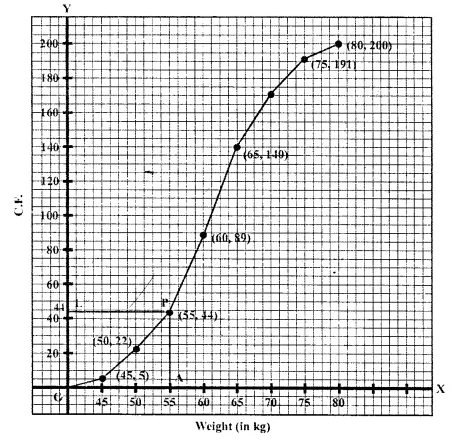
(i) From the graph, number of students weighing 55 kg or more = 200 – 44 = 156
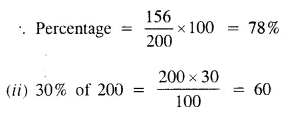
∴ Heaviest 60 students in weight = 9 + 20 + 31 = 60 (From the graph, the required weight is 65 kg or more but less than 80 kg)
(iii) Total number of students who are (i) under weight = 47 and (ii) over weight = 152 (∴ Standard weight is 55.70 kg)
P.Q.
Using step deviation method, find the mean of the following distribution.

Solution:
P.Q.
The daily wages of 80 workers in a building project are given below :
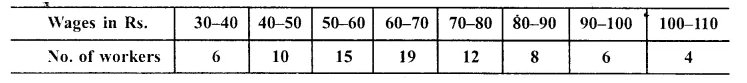
Using graph paper, draw an Ogive for the above distribution.
Use your Ogive to estimate : (i)the median wages of the workers.
(ii) the percentage of workers who earn more than Rs. 75 day.
(iii) the upper quartile wage of the workers.
(iv) the lower quartile wage of the workers.
(v) Inter quartile range.
Solution:
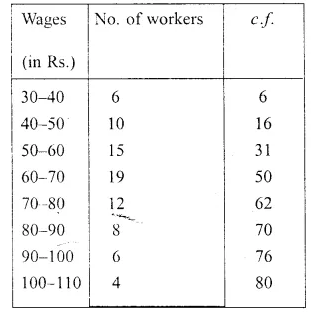
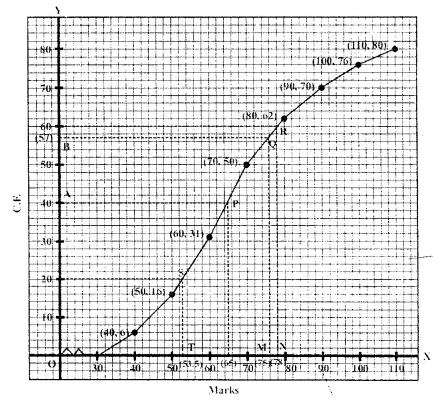
Now plot the points (40, 6), (50, 16), (60, 31), (70, 50), (80, 62), (90, 70) (100, 76). and (110, 80) on the graph and join them with free hand to get an ogive as shown.
(i) Median : \(\frac { N }{ 2 }\) = \(\frac { 80 }{ 2 }\) = 40
From 40 on y-axis, draw a line parallel to x- axis meeting the curve at P. From P, draw PL ⊥ x-axis
Then L is the median which is 65
∴ Median = Rs. 65
(ii) No. of workers earning more than Rs. 75 per day
From 75 on v-axis, draw a perpendicular meeting the curved at Q and from Q( draw a line parallel to x-axis which meet y-axis at B which is 57
∴No. of workers getting more than Rs. 75 per day = 80 – 57 = 23
From 60 on y-axis, draw- a line parallel to x- axis which meets the curve at R. From R, draw a perpendicular on x-axis meeting it at N.
From 20 on y-axis, draw a line parallel to x- axis meeting the curve at S. From S, draw a perpendicular on x-axis meeting it at T.
T is the lower quartile (Q1) which is 53.5
∴ Q1 = Rs. 53.50
(v) Inter quartile range = Q3 – Q1 = Rs. 78-53.50 = Rs. 24.50
Question 10.
The distribution given below shows the marks obtained by 25 students in an aptitude test. Find the mean, median and mode of the distribution.
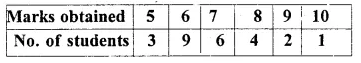
Solution:
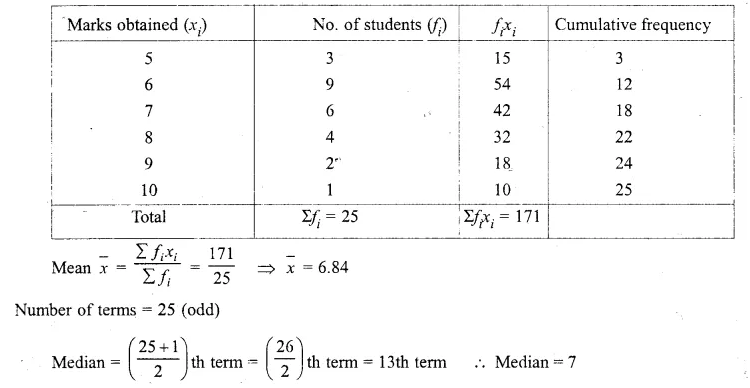
Mode = Marks with maximum frequency is 6 ∴ Mode = 6
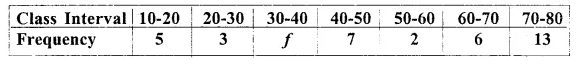
Question 11.
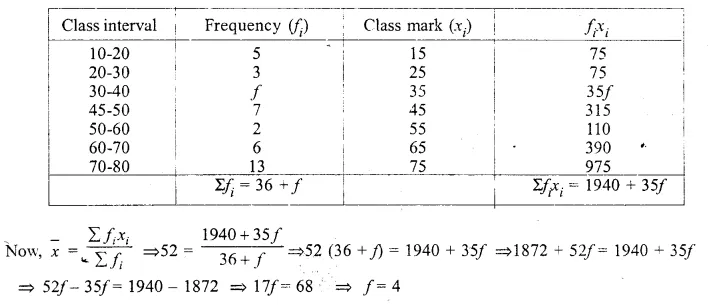
The mean of the following distribution is 52 and the frequency of class interval 30-40 is Find ‘f’ .Find ‘ f ‘.
Solution:
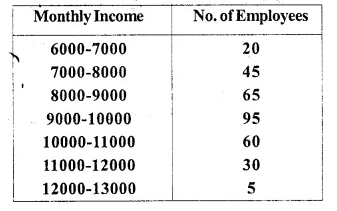
Question 12.
The monthly income of a group of 320 employees in a company is given below:
Draw an ogive of the given distribution on a graph sheet taking 2 cm = Rs. 1000 on one axis and 2 cm= 50 employees on the other axis.
From the graph determine
(i)the median wage
(ii)the number of employees whose income is below Rs. 8500.
(iii)If the salary of a senior employee is above Rs. 11,500, find the number of senior employees in the company.
(iv) the upper quartile.
Solution:
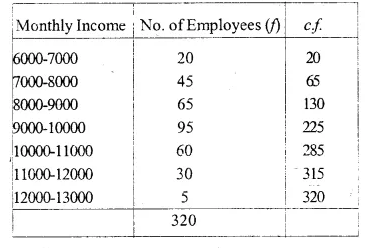
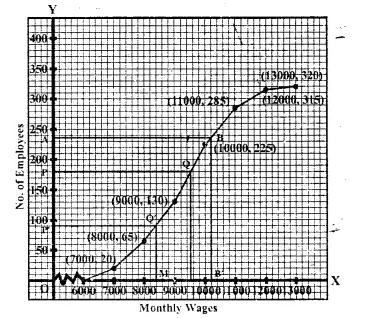
(i)For median wage, Take OP =\(\frac { 320 }{ 2 }\) =160 on y-axis, Draw a line PQ || x-axis and from Q,
draw QM ⊥ x-axis, abcissa of M point is 9400 ⇒ Median = Rs. 9400
(ii) Take OM’ = 8500 on.t-axis. Draw Q’M’|| toy-axis and P’Q’ || X-axis
Where ordinate of P’ is 92.5
There are approximately 93 employees whose monthly wage is below Rs. 8500
(iii) There are approximately 18 employees whose salary is above Rs. 11500.
(iv) Upper quartile
Mark a point A ony-axis on \(\frac { 3N }{ 4 }\) = \(\frac { 3 x 320 }{ 4 }\)= 240 and draw a line AB || X-axis, then draw BB’
⊥ x-axis abscissa of B’ is upper quartile i.e., Rs. 10250.
Question 13.
A Mathematics aptitude test of 50 students was recorded as follows :
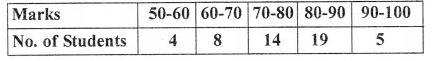
Draw a histogram for the above data using a graph paper and locate the mode.
Solution:
1. Draw the histogram with given data.
2. Inside the highest rectangle which represents the maximum frequency (or modal class), draw two lines AC and BD diagonally from the upper comer C and D or adjacent rectangle which intersect at K.
3. Draw KL ⊥ X-axis.
Value ofL is the mode which is 82.5 (approx).
Question 14.
Marks obtained by 200 students in an examination are given below :

Draw an ogive for the given distribution taking 2 cm = 10 marks on one axis and 2 cm = 20 students on the other axis. Using the graph, determine
(i) The median marks.
(ii) The number of students who failed if minimum marks required to pass is 40.
(iii) If scoring 85 and more marks is considered as grade one, find the number of students who secured grade one in the examination.
Solution:
(i) Median is 57.
(ii)44 students failed.
(iii) No. of students who secured grade one = 200 – 188 = 12
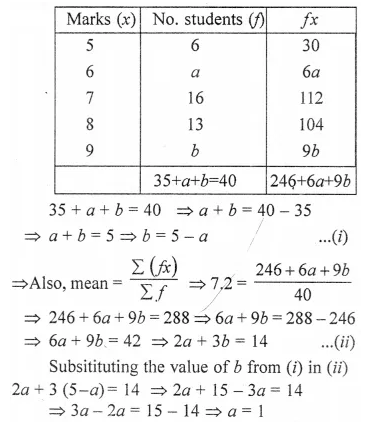
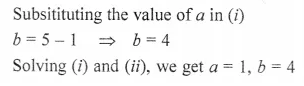
Question 15.
Marks obtained by 40 students in a short assessment are given below, where a and ft are two missing data.
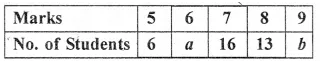
If the mean of the distribution is 7.2, find a and b.
Solution:
Question 16.
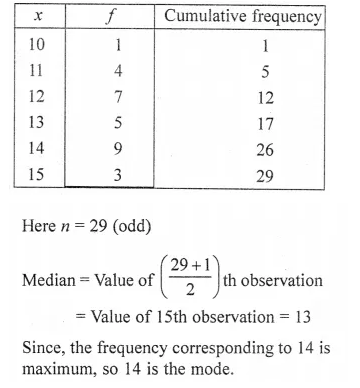
Find the mode and median of the following frequency distribution :
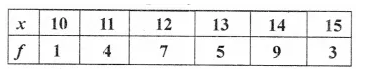
Solution:
Question 17.
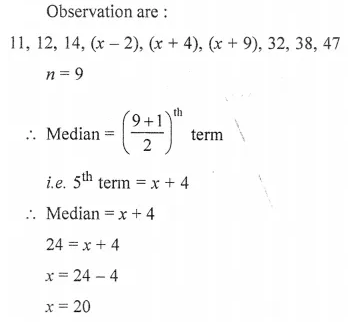
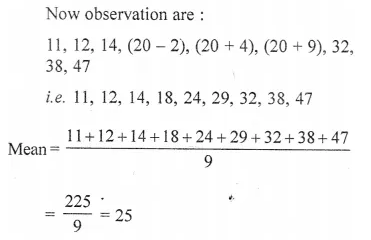
The median of the following observations 11, 12, 14, (x – 2), (x + 4), (x + 9), 32, 38, 47 arranged in ascending order is 24. Find the value of x and hence find the mean.
Solution:
Question 18.
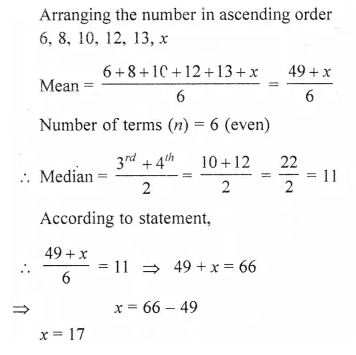
The numbers 6, 8, 10, 12, 13 and x are arranged in an ascending order. If the mean of the observations is equal to the median, find the value of x. (2014)
Solution:
Question 19.
(Use a graph paper for this question.) The daily pocket expenses of 200 students in a school are given below:
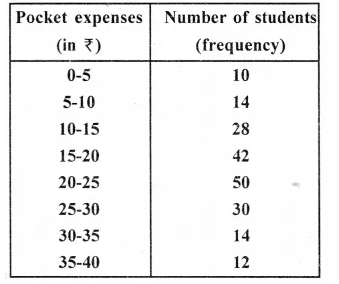
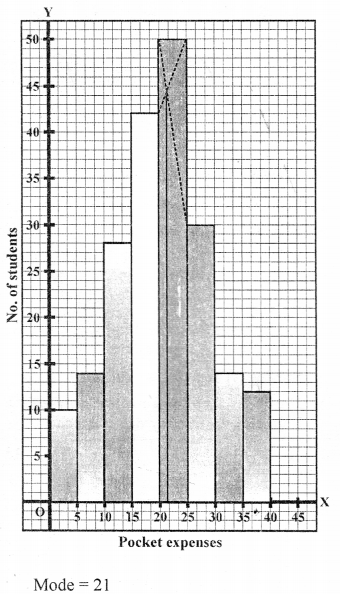
Draw a histogram representing the above distribution and estimate the mode from the graph. (2014)
Solution:
Steps of construction :
(i) Draw a line BC = 6.5 cm.
(ii) Centre B and C draw arcs AB = 5.5 cm and AC = 5 cm
(iii) Join AB and AC, ABC is the required triangle,
(iv) Draw the angle bisetors of B and C. Let these bisectors meet at O.
(v) Taking O as centre. Draw a incircle which touches all the sides of the ∆ ABC.
(vi) From O draw a perpendicular to side BC which cut at N.
(vii) Measure ON which is required radius of the incircle.
ON = 1.5 cm
Question 20.
The marks obtained by 100 students in a Mathematics test are given below :
Draw an ogive for the given distribution on a graph sheet.
Use a scale of 2 cm 10 units on both axes).
Use the ogive to estimate the:
(i) median.
(ii) lower quartile.
(iii) number of students who obtained more than 85% marks in the test.
(iv) number of students failed, If the pass percentage was 35. (2014)
Solution:
N= 100
Median = \(\frac { 100 }{ 2 }\) = 50th term Median = 45
(ii) Lower quartile : (Q1)
N = 100
⇒ \(\frac { N }{ 4 }\) = \(\frac { 100 }{ 4 }\) = 25
∴ Q1 = 32
(iii) Mo. of students with 85% less = 94
∴ More than 85% marks = 100 94 6
(iv) Number of students who did not pass = 30
Question 21.
The marks obtained by 30 students in a eiass assessment of 5 marks is given below :
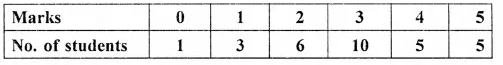
Calculate the mean, median and mode of the above distribution. (2015)
Solution:
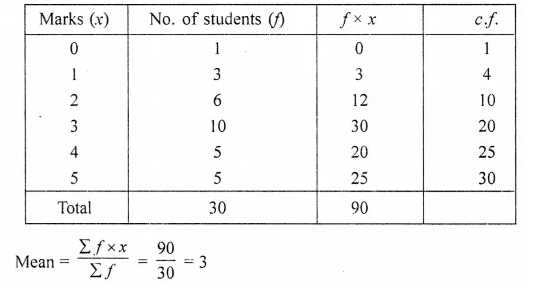
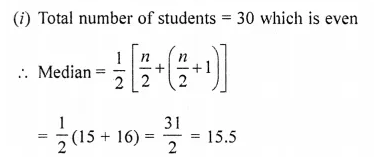
Which is between 10 and 20
∴ Median = 3
(ii) Mode frequency of 3 is the greatest
∴ Mode = 3
Question 22.
The weight of 50 workers is given below :
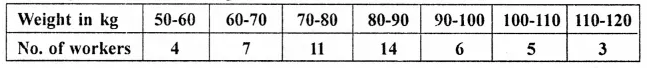
Draw an ogive of the given distribution using a graph sheet. Take 2 cm = 10 kg on one axis and 2 cm = 5 workers along the other axis. Use the ogive drawn to estimate the following:
(i) the upper and lower quartiles.
(ii) if weighing 95 Kg and above is considered overweight, find the number of workers who are overweight. (2015)
Solution:
Plot the points (60, 4), (70, 11), (80, 22), (90, 36), (100, 42) (110, 47) and (120, 50) on the graph and join them in order with free hand.
This is the required ogive
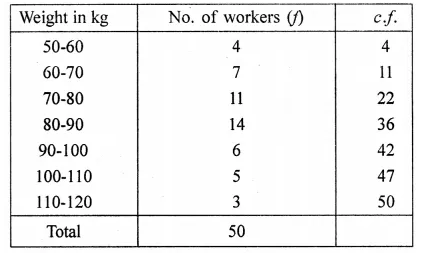
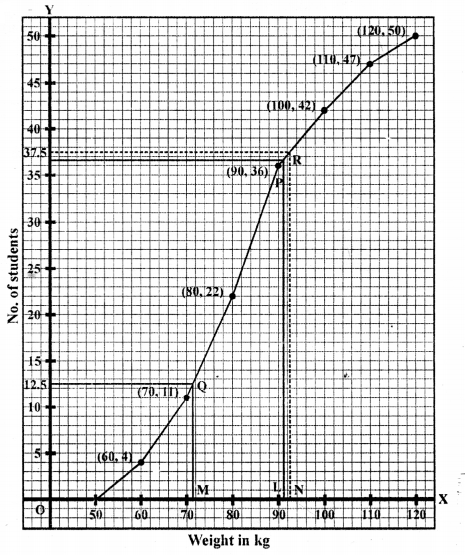
(i) Upper Quartile = \(\frac { 50 x 3 }{ 4 }\) th term = \(\frac { 150 }{ 4 }\) th = -37.5th term
Lower Quartile = \(\frac { 50 }{ 4 }\) th = 12.5th term
Upper quartile is 42 kg and lower quartile is 72 kg.
(ii) 95 kg and above are over weight
∴ No. of over weight students are 50 – 39 = 11 students.
Question 23.
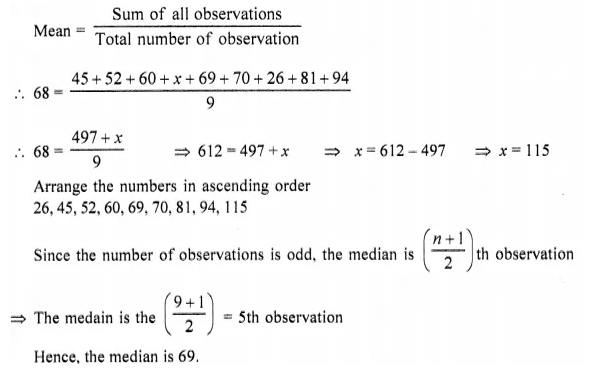
The mean of following number is 68. Find the value of ‘x’. 45, 52, 60, x, 69, 70, 26, 81 and 94. Hence estimate the median. (2016)
Solution:
Question 24.
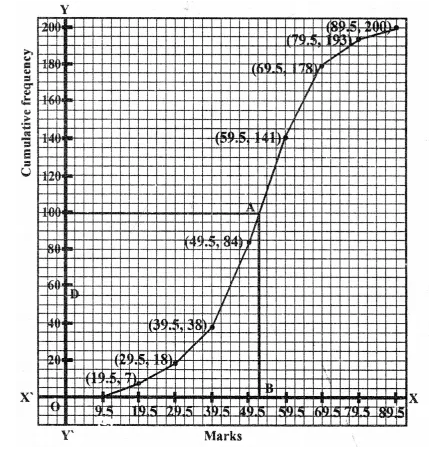
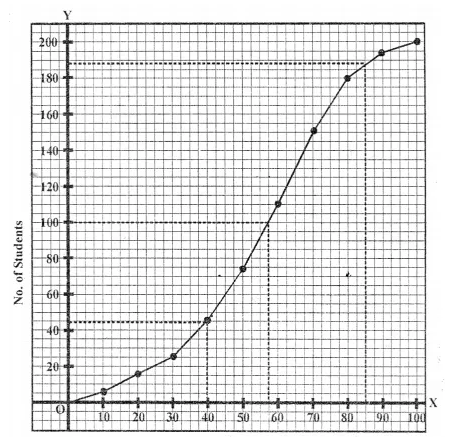
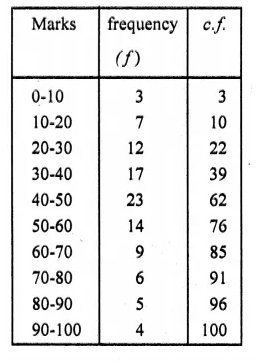
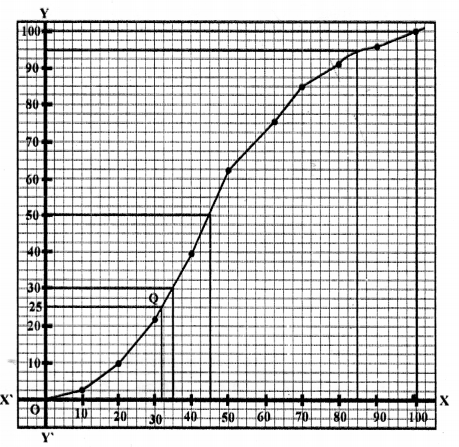
The table shows the distribution of the scores obtained by 160 shooters in a shooting competition. Use a graph sheet and draw an ogive for the distribution. (Take 2 cm = 10 scores on the X-axis and 2 cm = 20 shooters on the Y-axis). (2016)
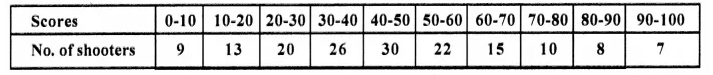
Use your graph to estimate the following :
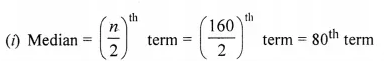
(i) The median.
(ii) The interquartile range.
(iii) The number of shooters who obtained a score of more than 85%.
Solution:
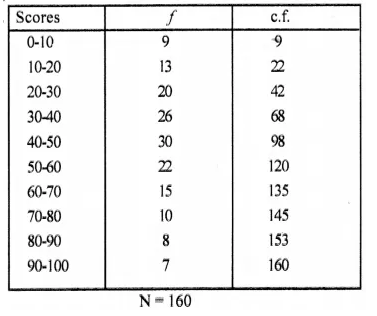
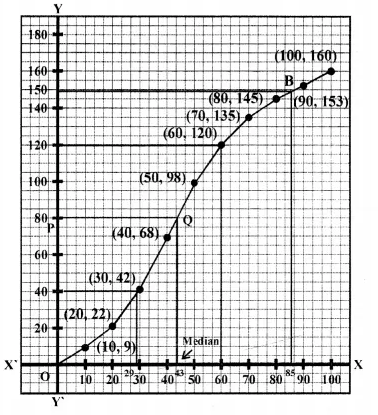
Through mark 80 on y-axis, draw a horizontal line which meets the ogive drawn at point Q.
Through Q, draw a vertical line which meets the x-axis at the mark of 43(app.).
∴ Median = 43
(ii) Since the number of terms = 160
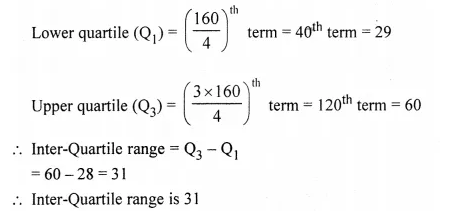
(iii) Since 85% scores = 85% of 100 = 85
Through mark for 85 on x-axis, draw a vertical line which meets the ogive drawn at point B.
Through the point B, draw a horizontal line which meets thej-axis at the mark of 148 = 160- 148= 12
So, the number of shooters who obtained more than 85% score is 12.
Question 25.
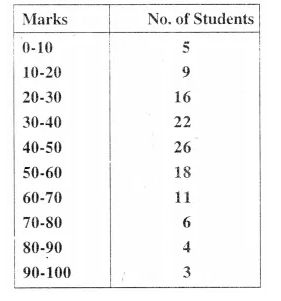
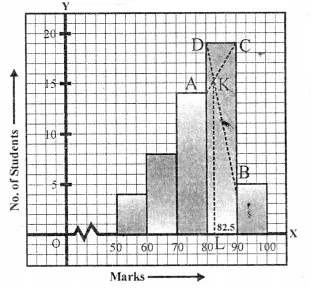
The histogram below represents the scores obtained by 25 students in a Mathematics mental test. Use the data to :
(i) Frame a frequency distribution table
(ii) To calculate mean
(iii) To determine the Modal class
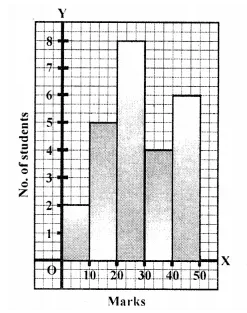
Solution:
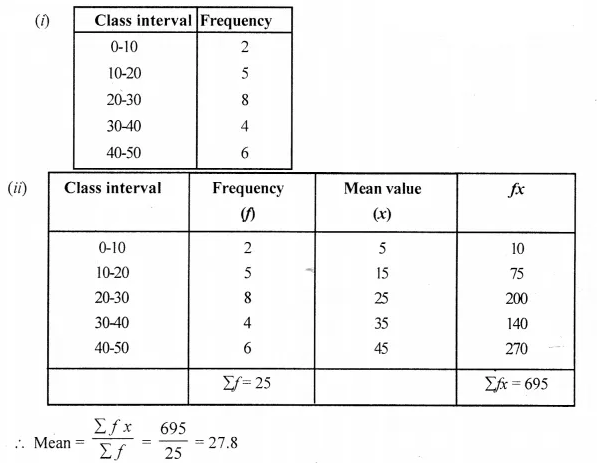
(iii) Here the maximum class frequency is 8, and the class corresponding to this frequency is 20-30. So, the modal class is 20-30.
Hope given Selina Concise Mathematics Class 10 ICSE Solutions Chapter 24 Measures of Central Tendency Ex 24E are helpful to complete your math homework.
If you have any doubts, please comment below. Learn Insta try to provide online math tutoring for you.