RD Sharma Class 8 Solutions Chapter 25 Data Handling III (Pictorial Representation of Data as Pie Charts or Circle Graphs) Ex 25.1
These Solutions are part of RD Sharma Class 8 Solutions. Here we have given RD Sharma Class 8 Solutions Chapter 25 Data Handling III Ex 25.1
Other Exercises
- RD Sharma Class 8 Solutions Chapter 25 Data Handling III Ex 25.1
- RD Sharma Class 8 Solutions Chapter 25 Data Handling III Ex 25.2
Question 1.
The number of hours, spent by a school boy on different activities in a working day, is given below:
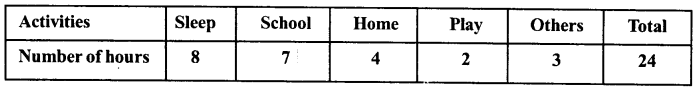
Present the information in the form of a pie-chart .
Solution:
Total = 24
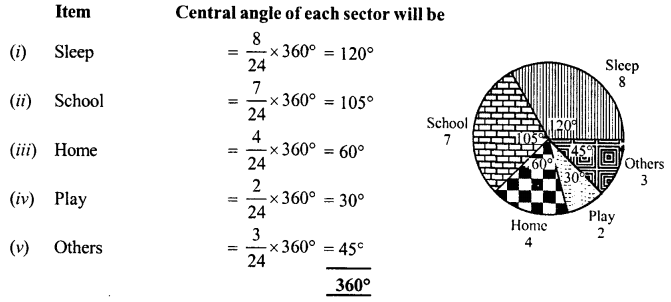
Now we draw a circle and divide it in the sectors having above central angles as shown in the figure.
Question 2.
Employees of a company have been categorized according to their religions as given below:
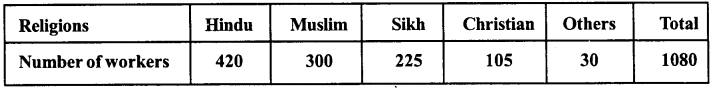
Draw a pie-chart to represent the above information.
Solution:
Total =1080
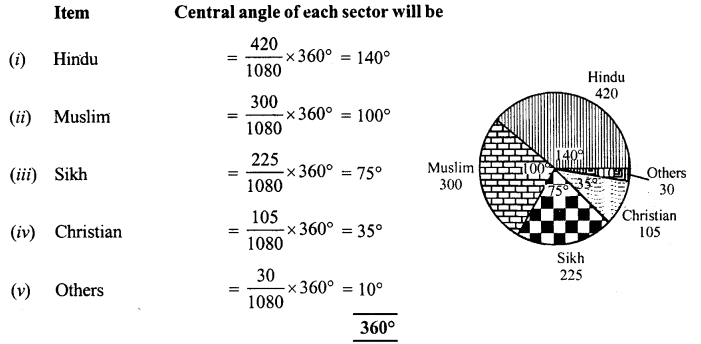
Now draw a circle and divided it into sectors having the above central angles as shown in the figure.
Question 3.
In one day the sales (in rupees) of different items of a baker’s shop are given below :
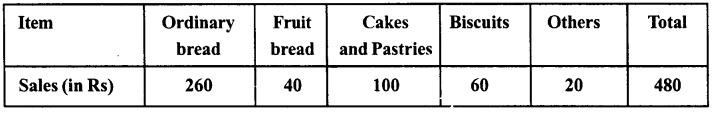
Draw pie-chart representing the above sales.
Solution:
Total = 480
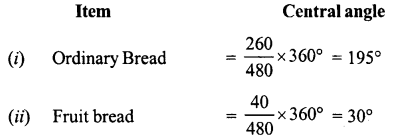
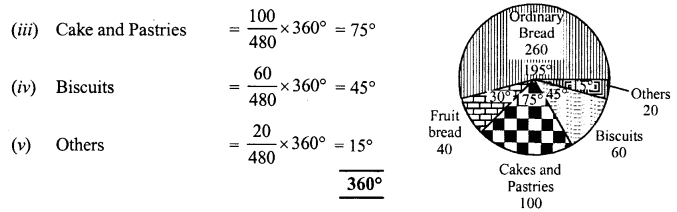
Now draw a circle and divide it into sectors having the above central angles as shown in the figure.
Question 4.
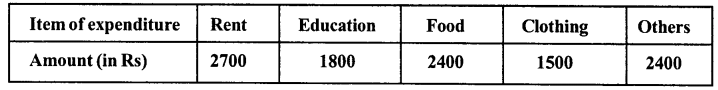
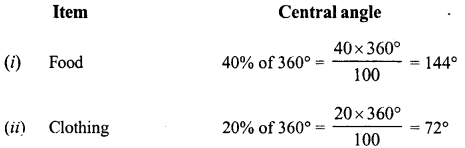
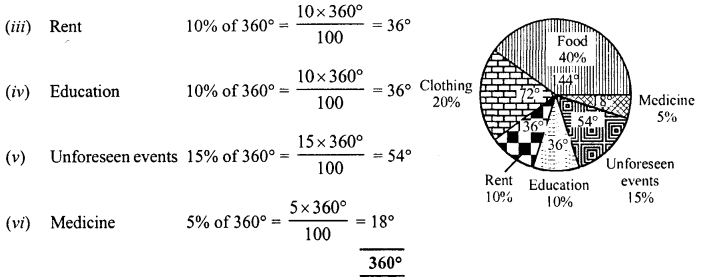
The following data shows the expenditure of a person on different items during a month. Represent the data by a pie-chart.
Solution:
Total = 10800
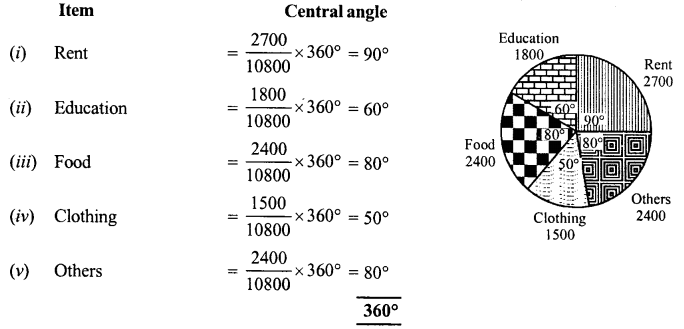
Now we draw a circle and divide it into sector having the above central angles as shown in figure.
Question 5.
The percentages of various categories of workers in a state are given in the following table:
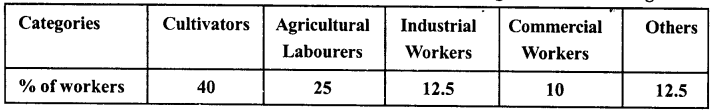
Present the information in the form of a pie-chart.
Solution:
Total = 100
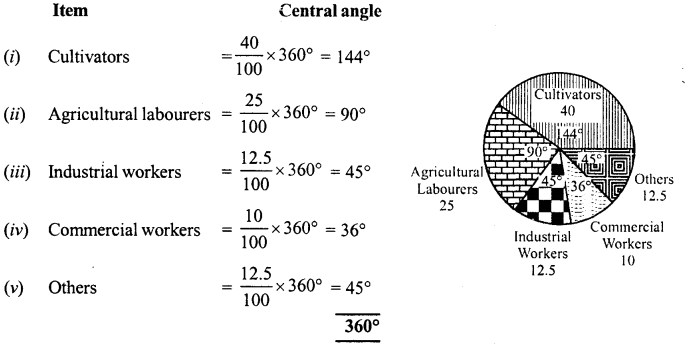
Now, we draw a circle and divide it into sectors having the above central angles as shown in the figure.
Question 6.
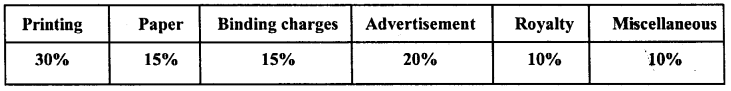
The following table shows the expenditure incurred by a publisher in publishing a book:
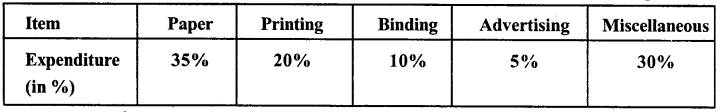
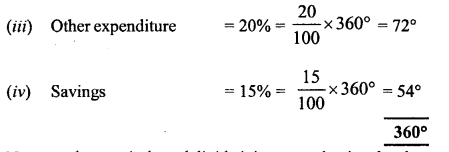
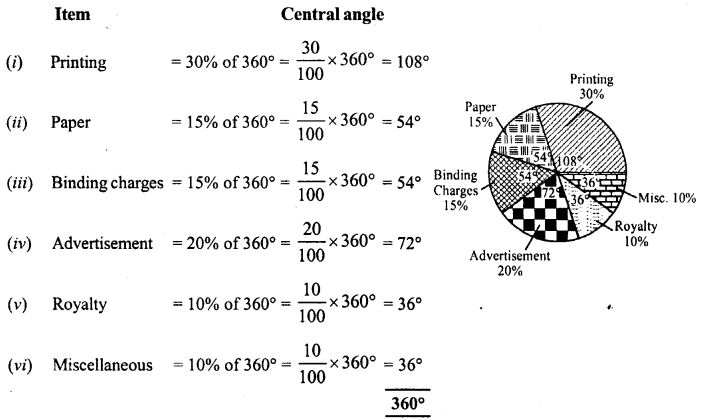
Present the above data in the form of a pie-chart.
Solution:
Total = 100% = 100
Now, we draw a circle and divide it into sectors having the above central angles as shown in the figure
Question 7.
Percentage of the different products of a village in a particular district are given below. Draw a pie-chart representing this information.
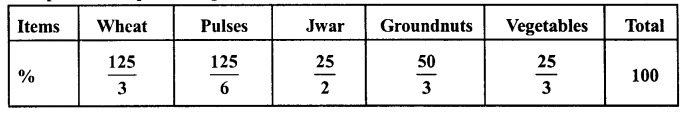
Solution:
Total = 100
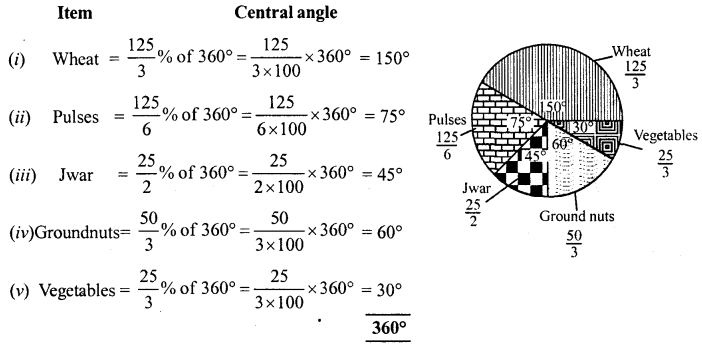
Now, we draw a circle and divided it into sectors having the above central angles as shown in the figure.
Question 8.
Draw a pie-diagram for the following data of expenditure pattern in a family.
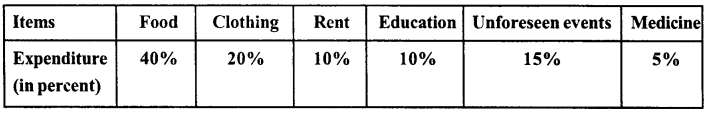
Solution:
Total =100
Now we draw a circle and divide it into sectors having the above central angles as shown in the figure.
Question 9.
Draw a pie-diagram of the areas of continents cf the world given in the following table :
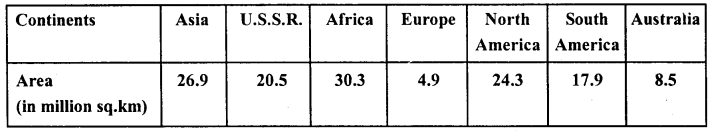
Solution:
Total = 133.3
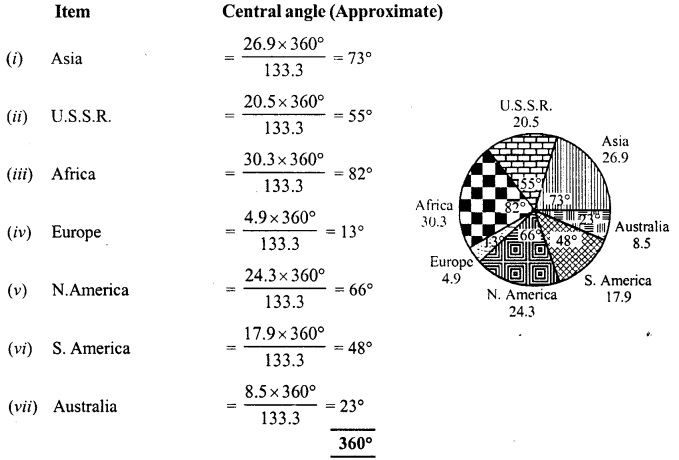
Now, we draw a circle and divide it into sectors having the above given central angles as shown in the figure.
Question 10.
The following data gives the amount spent of the construction of a house. Draw a pie diagram.
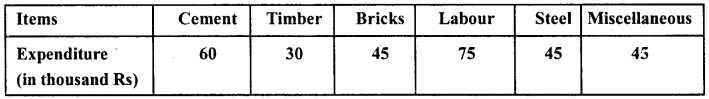
Solution:
Total = 300 (in thousands)
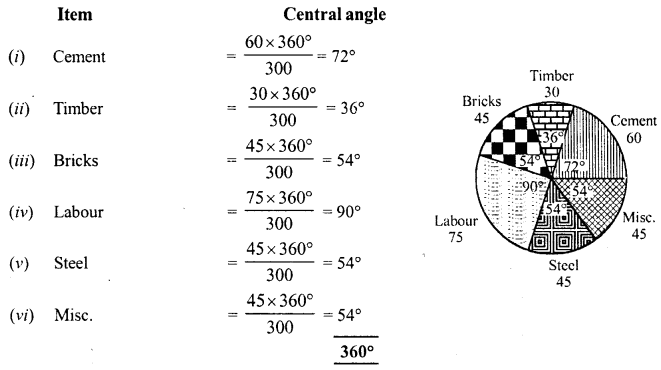
Now, we draw a circle and divide it into sectors having the above given central angles as shown in the figure.
Question 11.
The following table shows how a student spends his pocket money during the course of a month. Represent it by a pie-diagram.
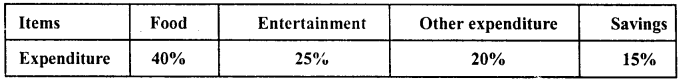
Solution:
Total expenditure = 100
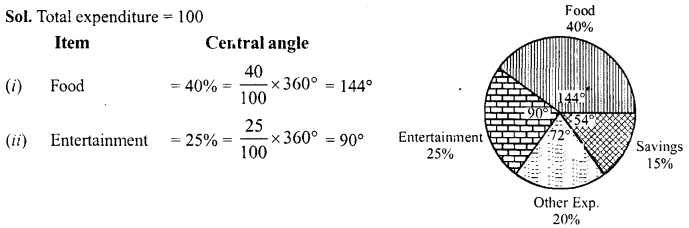
Now, we draw a circle and divide it into sectors having the above given central angles as shown in the figure.
Question 12.
Represent the following data by a pie-diagram :
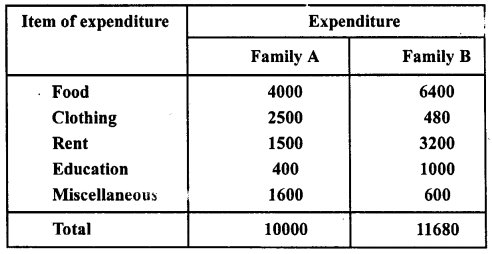
Solution:
1. For family A
Total = 10000
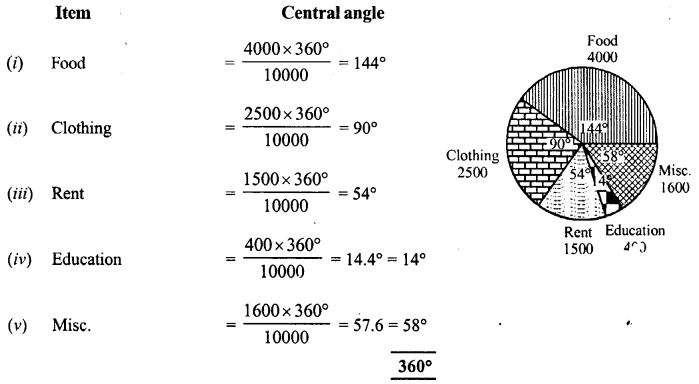
Now, we draw a circle and divide it in sectors having the above central angles as shown in the figure.
(2) For family B
Total = 11680
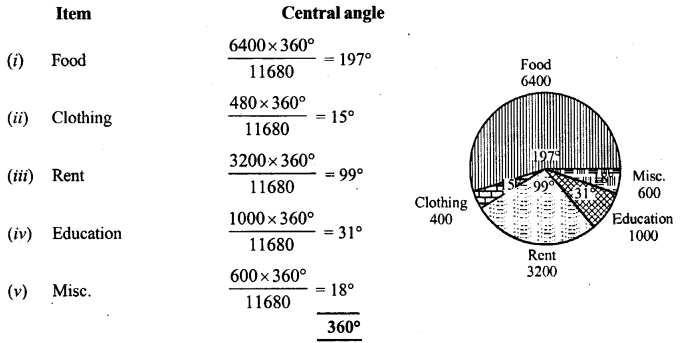
Now, we draw a circle and divide it into sectors having the above central angles as shown in the figure.
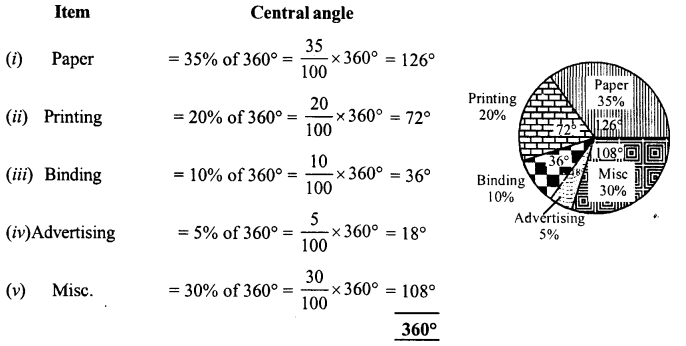
Question 13.
Following data gives the break up of the cost of production of a book:
Draw a pie – diagram depicting the above information.
Solution:
Total = 100
Now, we draw a circle and divide it into sectors of above central angles as shown in the figure.
Question 14.
Represent the following data with the help of pie-diagram.
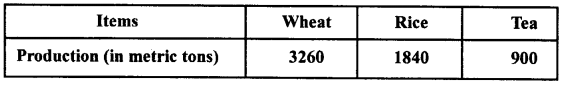
Solution:
Total = 6000 tons
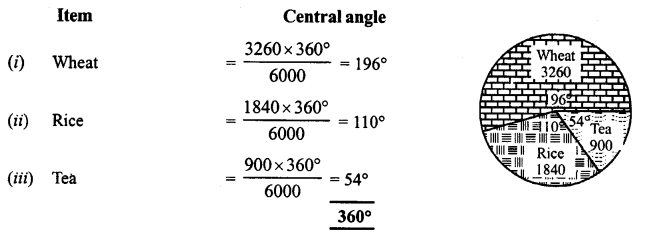
Now, we draw a circle and divide it into sectors having the above central angles as shown in the figure.
Question 15.
Draw a pie-diagram representing the relative frequencies (expressed as percentage) of the eight classes as given below :
12.6,18.2,17.5,20.3,2.8,4.2,9.8,14.7
Solution:
Total =100
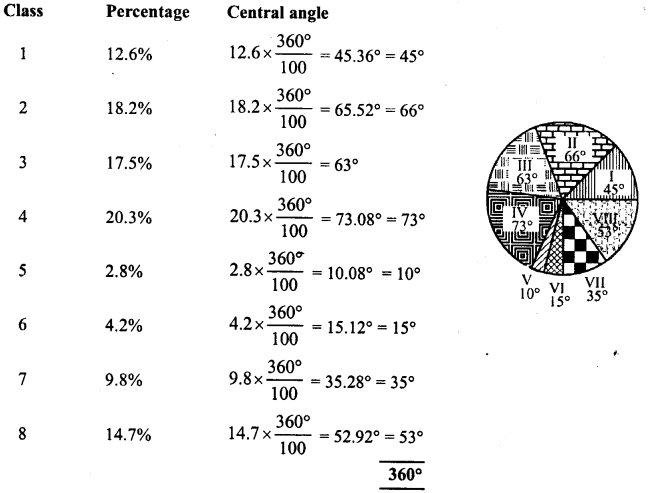
Now, we draw a circle and divide it into sectors having the above central angles as shown in the figure given.
Question 16.
Following is the break up of the expenditure of a family on different items of consumption :
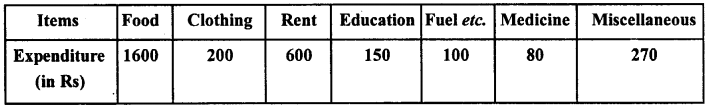
Draw a a pie – diagram to represent the above data.
Solution:
Total = Rs. 3000
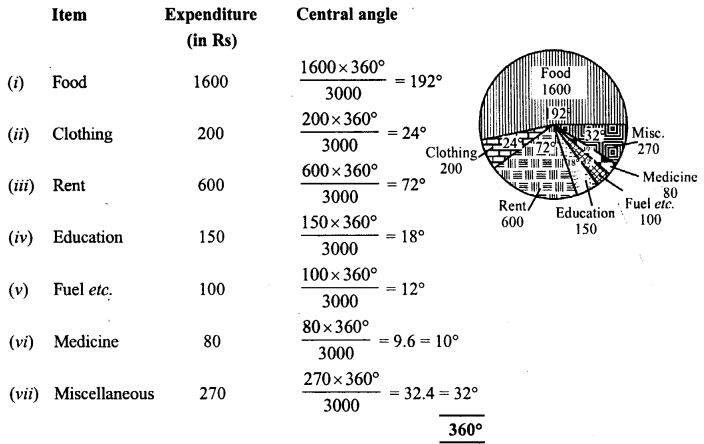
Now, we draw a circle and divide it into sectors having the above central angles as shown in the figure.
Question 17.
Draw a pie-diagram for the following data of the investment pattern in five year plan :
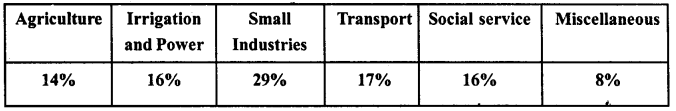
Solution:
Total = 100
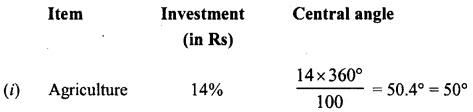
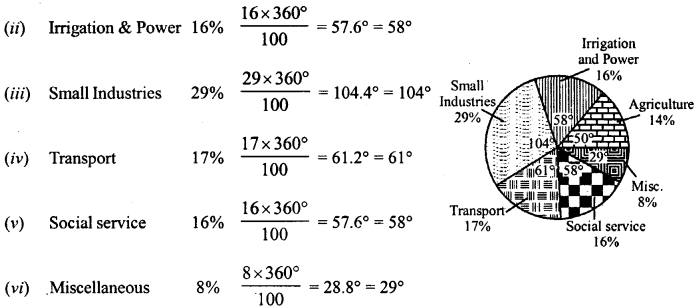
Now, we draw a circle and divide it into sectors having the above central angles as shown in the figure.
Hope given RD Sharma Class 8 Solutions Chapter 25 Data Handling III Ex 25.1 are helpful to complete your math homework.
If you have any doubts, please comment below. Learn Insta try to provide online math tutoring for you.