NCERT Solutions for Class 9 Maths Chapter 3 Introduction to Euclid’s Geometry Ex 3.1 are part of NCERT Solutions for Class 9 Maths. Here we have given NCERT Solutions for Class 9 Maths Chapter 3 Introduction to Euclid’s Geometry Ex 3.1.
| Board | CBSE |
| Textbook | NCERT |
| Class | Class 9 |
| Subject | Maths |
| Chapter | Chapter 3 |
| Chapter Name | Introduction to Euclid’s Geometry |
| Exercise | Ex 3.1 |
| Number of Questions Solved | 7 |
| Category | NCERT Solutions |
NCERT Solutions for Class 9 Maths Chapter 3 Introduction to Euclid’s Geometry Ex 3.1
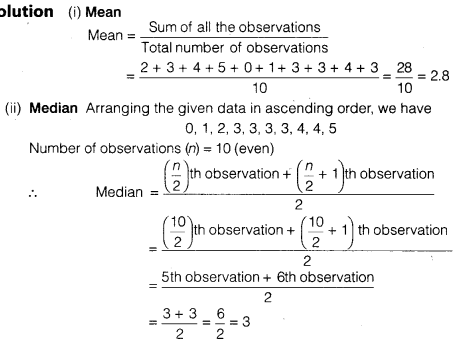
Question 1.
Which of the following statements are true and which are false? Give reasons for your answers.
(i) Only one line can pass through a single point.
(ii) There are an infinite number of lines which pass through two distinct points.
(iii) A terminated line can be produced indefinitely on both the sides.
(iv) If two circles are equal, then their radii are equal.
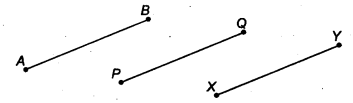
(v) In figure, if AB – PQ and PQ = XY, then AB = XY.
Solution:
(i) False. In a single point, infinite number of lines can pass through it.
(ii) False. For two distinct points only one straight line is passing.
![]()
(iii) True.
![]()
(iv) True. [∵ Radii of congruent (equal) circles are always equal]
(v) True. AB = PQ …..(i)
PQ = XY
⇒ XY = PQ …(ii)
From Eqs. (i) and (ii), we get AB = XY
Question 2.
Give a definition for each of the following terms. Are there other terms that need to be defined first? What are they and how might you define them?
(i) Parallel lines
(ii) Perpendicular lines
(iii) Line segment
(iv) Radius of a circle
(v) Square
Solution:
(i) Parallel lines Two lines in a plane are said to be parallel, if they have no point in common.
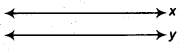
In figure, x and y are said to be parallel because they have no point in . common and we write, x\(\parallel\)
y.
Here, the term point is undefined.
(ii) Perpendicular lines Two lines in a plane are said to be perpendicular, if they intersect each other at one right angle.
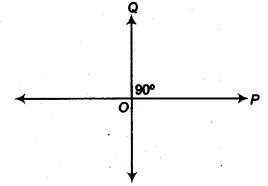
In figure, P and Q are said to be perpendicular lines because they ; intersect each other at 90° and we write Q ⊥ P.
Here, the term one right angle is undefined.
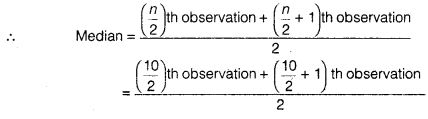
(iii) Line segment The definite length between two points is called the line segment.
![]()
In figure, the definite length between A and B is line represented by \(\overline { AB }\).
Here, the term definite length is undefined.
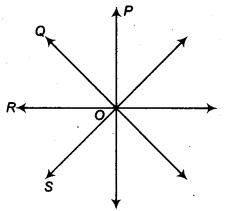
(iv) Radius of a circle The distance from the centre to a point on the circle is called the radius of the circle.

In the adjoining figure OA is the radius.
Here, the term, point and centre is undefined.
(v) Square A square is a rectangle having same length and breadth.
Here, the terms length, breadth and rectangle are undefined.
Question 3.
Consider two ‘postulates’ given below
(i) Given any two distinct points A and B, there exists a third point C which is in between A and B.
(ii) There exist atleast three points that are not on the same line.
Do these postulates contain any undefined terms? Are these postulates consistent? Do they follow from Euclid’s postulates? Explain.
Solution:
There are so many undefined words which should be knowledge. They are consistent because they deal with two different situations that is
(i) if two points A and B are given, then there exists a third point C which is in between A and B.
(ii) if two points A and B are given, then we can take a point C which don’t lie on the line passes through the point A and B.
These postulates don’t follow Euclid’s postulates. However, they follow axiom Euclid’s postulate 1 stated as through two distinct points, there is a unique line that passes through them.
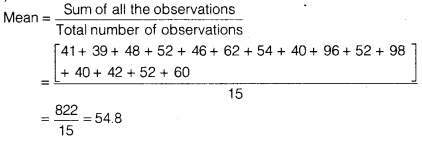
Question 4.
If a point C lies between two points A and B such that AC = BC, then prove that AC = \(\frac { 1 }{ 2 }\) AB, explain by drawing the figure.
Solution:
Line AB is drawn by joining A and B using between a point C is taken. AC is taken and put on line AB.
![]()
i.e., AC covers the line segment AB in two overlaps.
∴ AB = AC + AC
AB = 2 AC
⇒ AC = \(\frac { 1 }{ 2 }\) AB
Question 5.
In question 4, point C is called a mid-point of line segment AB. Prove that every line segment has one and only one mid-point.
Solution:
Here, C is the mid-point of line segment AB, such that AC = BC
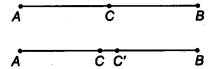
Let there are two mid-points C and C’ of AB.
⇒ AC = \(\frac { 1 }{ 2 }\) AB
and AC’ = \(\frac { 1 }{ 2 }\) AB
⇒ AC = AC’
which is only possible when C and C’ coincide.
⇒ Point C’ lies on C.
Hence, every line segment has one and only one mid-point.
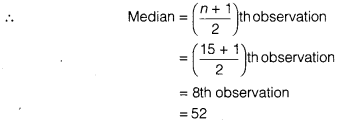
Question 6.
In figure, if AC = BD, then prove that AB = CD.
![]()
Solution:
We have
AC = BC
⇒ AC – BC = BD – BC (∵ Equals are subtracted from equals)
⇒ AB = CD
Question 7.
Why is axiom 5, in the list of Euclid’s axioms, considered a ‘universal truth’?
(Note that, the question is not about the fifth postulate.)
Solution:
According to axiom 5, we have The whole is greater than a part, which is a universal truth.
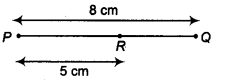
Let a line segment PQ = 8 cm. Consider a point R in its interior, such that PR = 5 cm
Clearly, PR is a part of the line segment PQ and ft lies in its interior.
⇒ PR is smaller than PQ.
Hence, the whole is greater than its part.
We hope the NCERT Solutions for Class 9 Maths Chapter 3 Introduction to Euclid’s Geometry Ex 3.1 help you. If you have any query regarding NCERT Solutions for Class 9 Maths Chapter 3 Introduction to Euclid’s Geometry Ex 3.1, drop a comment below and we will get back to you at the earliest.