RS Aggarwal Class 6 Solutions Chapter 1 Number System Ex 1H

RS Aggarwal Class 6 Solutions Chapter 1 Number System Ex 1H

These Solutions are part of RS Aggarwal Solutions Class 6. Here we have given RS Aggarwal Solutions Class 6 Chapter 1 Number System Ex 1H

Other Exercises

Objective questions
Mark against the correct answer in each of the following

Question 1.
Solution:
(c) Place value of 6 in 48632950 is 600000

Question 2.
Solution:
(a) Face value of 4 in the numeral 89247605 is 4
(∴ Face value does not alter)

Question 3.
Solution:
(c) The place of 5 in the numeral 78653421 is 50000 and face value is 5
∴ Difference between 50000 and 5 = 49995

Question 4.
Solution:
(b) The smallest counting number is 1

Question 5.
Solution:
(b) 4-digit numbers are 1000 to 9999
=> 9999 – 999
= 9000

Question 6.
Solution:
(b) 7-digit numbers are from 1000000 to 9999999 or 9999999 – 999999
= 9000000

Question 7.
Solution:
(c) 8-digit numbers are to 99999999 99999999 – 9999999
= 90000000

Question 8.
Solution:
The number before 1000000 will be 1000000 – 1 = 999999 (b)

Question 9.
Solution:
(a) VX is not meaningful as V does not come before X

Question 10.
Solution:
(c) IC is not meaningful as I comes before V and X only

Question 11.
Solution:
(b) XVV is not meaningful as V does not comes more than once.

Hope given RS Aggarwal Solutions Class 6 Chapter 1 Number System Ex 1H are helpful to complete your math homework.

If you have any doubts, please comment below. Learn Insta try to provide online math tutoring for you.

RS Aggarwal Class 6 Solutions Chapter 1 Number System Ex 1G

RS Aggarwal Class 6 Solutions Chapter 1 Number System Ex 1G

These Solutions are part of RS Aggarwal Solutions Class 6. Here we have given RS Aggarwal Solutions Class 6 Chapter 1 Number System Ex 1G

Other Exercises

Question 1.
Solution:
(i) 2 = II
(ii) 8 = VIII
(iii) 14 = XIV
(iv) 29 = XXIX
(v) 36= XXXVI
(vi) 43 = XLIII
(vii) 54 = LIV
(viii) 61 = LXI
(ix) 73 = LXXIII
(x) 81 = LXXXI
(xi) 91 = XCI
(xii) 95 XCV
(xiii) 99= XCIX
(xiv) 105 CV
(xv) 114 = CXIV

Question 2.
Solution:
(i) 164 = CLXIV
(ii) 195 = CXCV
(iii) 226 = CCXXVI
(iv) 341 = CCCXLI
(v) 475 = CDLXXV
(vi) 596 = DXCVI
(vii) 611 = DCXI
(viii) 759 = DCCLIX

Question 3.
Solution:
(i) XXVII = 27
(ii) XXXIV = 34
(iii) XLV = 45
(iv) LIV = 54
(v) LXXIV = 74
(vi) XCI = 91
(vii) XCVI = 96
(viii) CXI = 111
(ix) CLIV = 154
(x) CCXXIV = 224
(xi) CCCLXV = 365
(xii) CDXIV = 414
(xiii) CDLXIV = 464
(xiv) DVI = 506
(xv) DCCLXVI = 766

Question 4.
Solution:
(i) V is never subtracted
∴ VC is wrong
(ii) I can be subtracted from V and X only
∴ IL is wrong
(iii) V, L, D are never repeated
∴ VVII is wrong
(iv) IX cannot occur to the left of X
∴ IXX is wrong

Hope given RS Aggarwal Solutions Class 6 Chapter 1 Number System Ex 1G are helpful to complete your math homework.

If you have any doubts, please comment below. Learn Insta try to provide online math tutoring for you.

RD Sharma Class 8 Solutions Chapter 27 Introduction to Graphs Ex 27.2

RD Sharma Class 8 Solutions Chapter 27 Introduction to Graphs Ex 27.2

These Solutions are part of RD Sharma Class 8 Solutions. Here we have given RD Sharma Class 8 Solutions Chapter 27 Introduction to Graphs Ex 27.2

Other Exercises

Question 1.
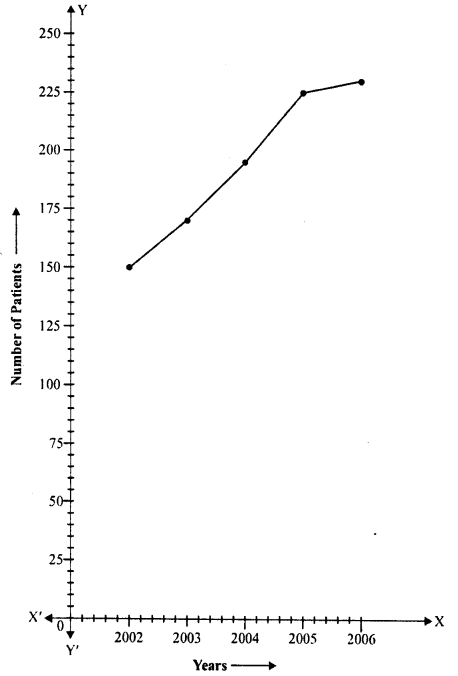
The following table shows the number of patients discharged from a hospital with HIV diagnosis in different years :
RD Sharma Class 8 Solutions Chapter 27 Introduction to Graphs Ex 27.2 1
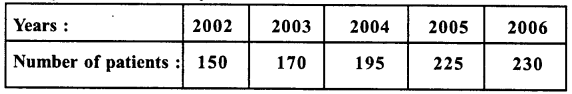
Represent this information by a graph.
Solution:
Represent years along x-axis and number of patients along y-axis. Now, plot the points (2002, 150), (2003, 170), (2004, 195), (2005, 225) and (2006, 230) on the graph and join them in order. We get the required graph as shown on the graph.
RD Sharma Class 8 Solutions Chapter 27 Introduction to Graphs Ex 27.2 2

Question 2.
The following table shows the amount of rice grown by a farmer in different years :
RD Sharma Class 8 Solutions Chapter 27 Introduction to Graphs Ex 27.2 3
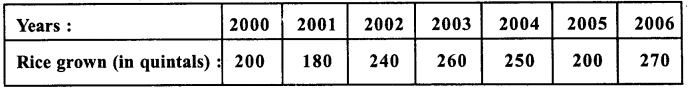
Plot a graph to illustrate this information.
Solution:
We represent years along x-axis and rice (in quintals) along y-axis. Now we plot the points (2000,200), (2001, 180), (2002,240), (2003,260), (2004,250), (2005,200) and (2006,270) on the graph and join them in order as shown on the graph.
RD Sharma Class 8 Solutions Chapter 27 Introduction to Graphs Ex 27.2 4

Question 3.
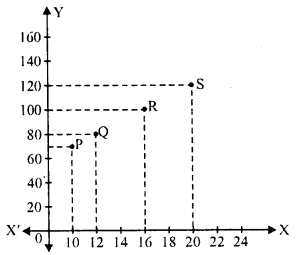
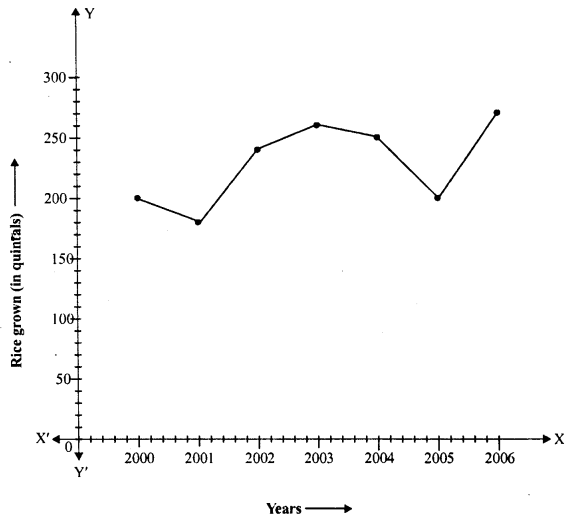
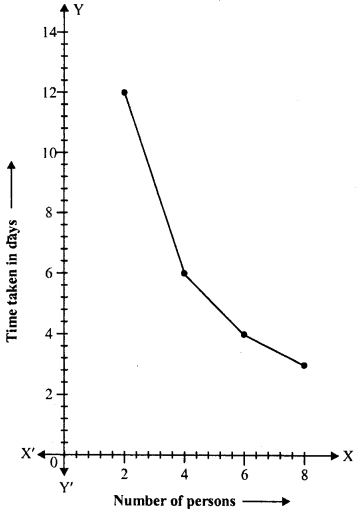
The following table gives the information regarding the number of persons employed to a piece of work and time taken to complete the work:
RD Sharma Class 8 Solutions Chapter 27 Introduction to Graphs Ex 27.2 5
Plot a graph of this information.
Solution:
We represent number of person along x-axis and time taken in day along y-axis. Now plot the points (2,12), (4,6), (6,4) and (8, 3) on the graph and join them in order as shown on the graph.
RD Sharma Class 8 Solutions Chapter 27 Introduction to Graphs Ex 27.2 6

Question 4.
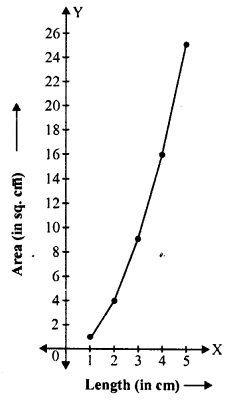
The following table gives the information regarding length of a side of a square and its area :
RD Sharma Class 8 Solutions Chapter 27 Introduction to Graphs Ex 27.2 7
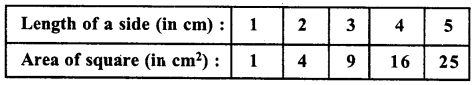
Draw a graph to illustrate this information.
Solution:
We represent length of a side (in cm) along x-axis and Area of square (in cm2) along the y-axis. Now plot the points (1,1), (2, 4), (3, 9), (4, 16) and (5, 25) on the graph and join them in order. We get the required graph as shown on the graph.
RD Sharma Class 8 Solutions Chapter 27 Introduction to Graphs Ex 27.2 8

Question 5.
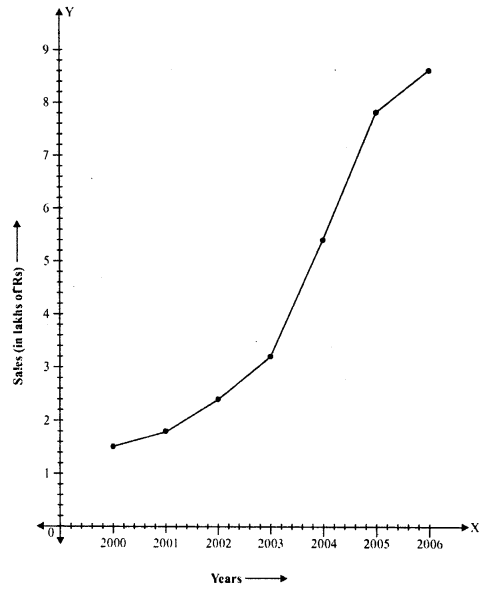
The following table shows the sales of a commodity during the years 2000 to 2006.
RD Sharma Class 8 Solutions Chapter 27 Introduction to Graphs Ex 27.2 9
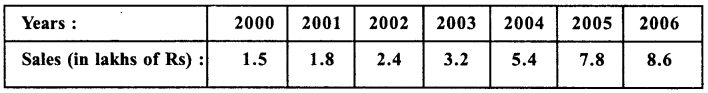
Draw a graph of this information.
Solution:
We represent years on x-axis and sales (in lakh rupees) along y-axis. Now plot the points
(2000, 1.5), (2001, 1.8), (2002, 2.4), (2003, 3.2), (2004, 5.4), (2005, 7.8) and (2006, 8.6) on the graph and join them in order we get the required graph as shown.
RD Sharma Class 8 Solutions Chapter 27 Introduction to Graphs Ex 27.2 10

Question 6.
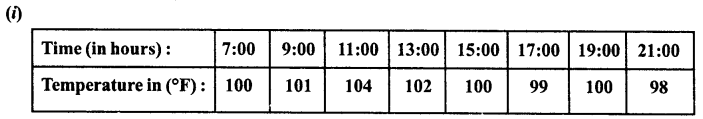
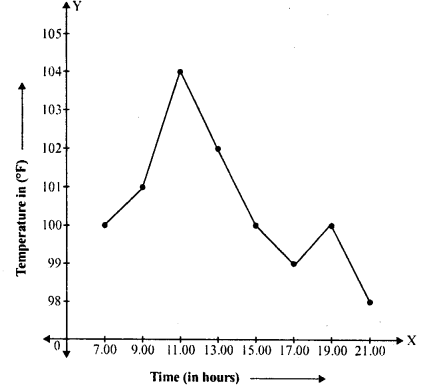
Draw the temperature-time graph in each of the following cases :
RD Sharma Class 8 Solutions Chapter 27 Introduction to Graphs Ex 27.2 11
Solution:
(i) We represent time along x-axis and temperature (in °F) alongy-axis. Now plot the points (7:00, 100), (9:00, 101), (11:00, 104), (13:00, 102), (15:00, 100), (17:00, 99), (19:00, 100) and (21:00, 98) on the graph and join them in order to get the required graph as shown on the graph.
RD Sharma Class 8 Solutions Chapter 27 Introduction to Graphs Ex 27.2 12
RD Sharma Class 8 Solutions Chapter 27 Introduction to Graphs Ex 27.2 13
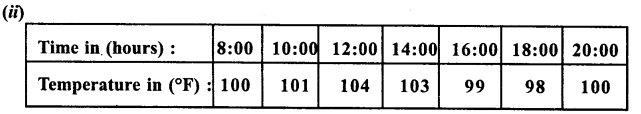
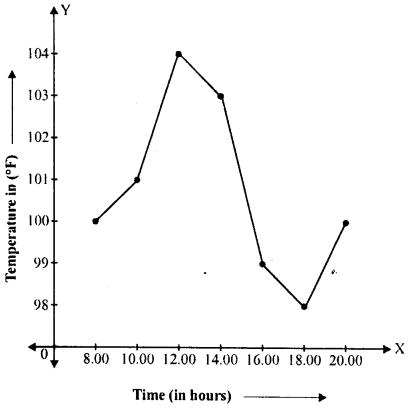
(ii) We represent time along x-axis and temperature (in °F) along j-axis. Now plot the points (8:00, 100), (i0:00, 101), (12:00, 104), (14:00, 103), (16:00, 99), (18:00,98), (20:00,100) on the graph and join them in order to get the required graph as shown on the graph.
RD Sharma Class 8 Solutions Chapter 27 Introduction to Graphs Ex 27.2 14

Question 7.
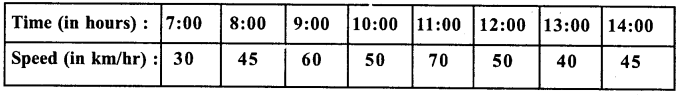
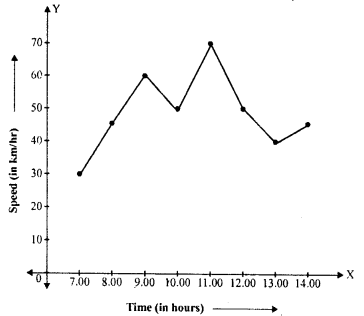
Draw the velocity-time graph from the following data :
RD Sharma Class 8 Solutions Chapter 27 Introduction to Graphs Ex 27.2 15
Solution:
We represent time (in hours) along x- axis and speed (in km/hr) along y-axis. Now plot the points (7:00,30), (8:00,45), (9:00,60), (10:00, 50), (11:00, 70), (12:00, 50), (13:00, 40) and (14:00,45) on the graph and join them in order to get the required graph as shown.
RD Sharma Class 8 Solutions Chapter 27 Introduction to Graphs Ex 27.2 16

Question 8.
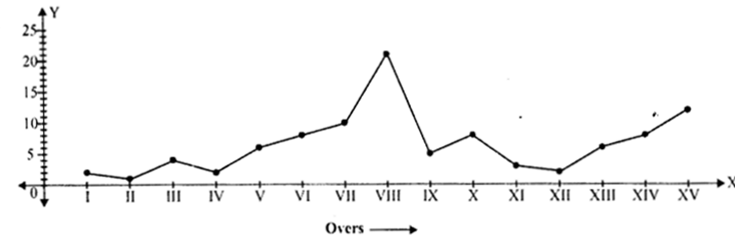
The runs scored by a cricket team in first 15 overs are given below :
RD Sharma Class 8 Solutions Chapter 27 Introduction to Graphs Ex 27.2 17
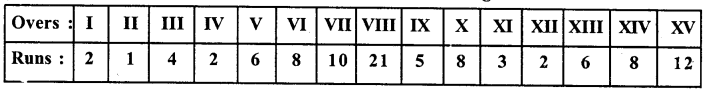
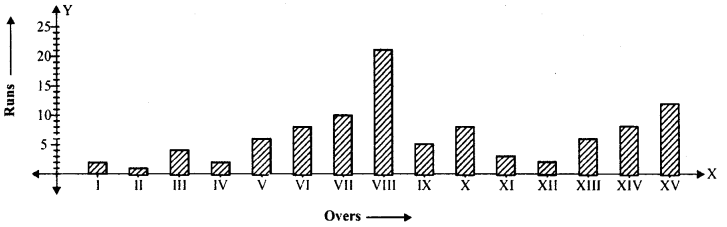
Draw the graph representing the above data in two different ways as a graph and as a bar chart.
Solution:
We represent overs along.t-axis and runs along v-axis. Now plot the points (1,2), (II, 1), (III, 4), (IV, 2), (V, 6), (VI, 8), (VII, 10), (VIII, 21), (IX, 5), (X, 8), (XI, 3), (XII, 2), (XIII, 6), (XIV, 8), (XV, 12) on the graph and join them to get the graph, as shown bar graph of the given data is given below:
RD Sharma Class 8 Solutions Chapter 27 Introduction to Graphs Ex 27.2 18
RD Sharma Class 8 Solutions Chapter 27 Introduction to Graphs Ex 27.2 19

Question 9.
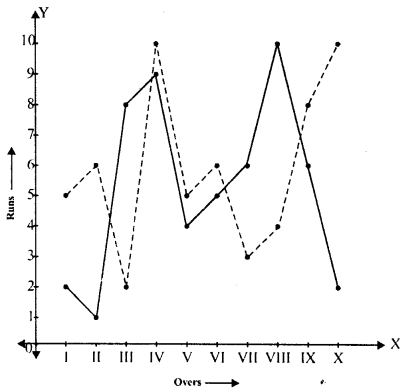
The runs scored by two teams A and B in first 10 overs are given below :
RD Sharma Class 8 Solutions Chapter 27 Introduction to Graphs Ex 27.2 20
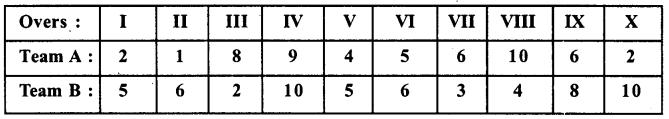
Draw a graph depicting the data, making the graphs on the same axes in each case in two different ways as a graph and as a bar chart.
Solution:
We represent overs along x-axis and runs scored by team A and team B with different types of lines along y-axis.
Plot the points for team A : (I, 2), (II, 1), (III,8), (IV, 9), (V, 4), (VI, 5), (VII, 6), (VIII, 10), (IX, 6) and (X, 2)
and for team B, the points will be : (I, 5), (II, 6), (III, 2), (IV, 10), (V, 5), (VI, 6), (VII, 3), (VIII, 4), (IX, 8), (X, 10).
Then join them in order to get the required graph for team A and team B as shown.
Note : For team A ………
for team B …………
RD Sharma Class 8 Solutions Chapter 27 Introduction to Graphs Ex 27.2 21

Hope given RD Sharma Class 8 Solutions Chapter 27 Introduction to Graphs Ex 27.2 are helpful to complete your math homework.

If you have any doubts, please comment below. Learn Insta try to provide online math tutoring for you.

RS Aggarwal Class 6 Solutions Chapter 1 Number System Ex 1F

RS Aggarwal Class 6 Solutions Chapter 1 Number System Ex 1F

These Solutions are part of RS Aggarwal Solutions Class 6. Here we have given RS Aggarwal Solutions Class 6 Chapter 1 Number System Ex 1F

Other Exercises

Find the estimated quotient for each of the following :

Question 1.
Solution:
87 ÷ 28
87 is estimated to the nearest ten = 90
28 is estimated to the nearest ten = 30
∴ 90 ÷ 30
= 3 Ans.

Question 2.
Solution:
83 ÷ 17
83 is estimated to the nearest ten = 80
17 is estimated to the nearest ten = 20
∴ 80 ÷ 20
= 4 Ans.

Question 3.
Solution:
75 ÷ 23
75 is estimated to the nearest ten = 80
23 is estimated to the nearest ten = 20
∴ 80 ÷ 20
= 4 Ans.

Question 4.
Solution:
193 ÷ 24
193 is estimated to the nearest ten = 200
24 is estimated to the nearest ten = 20
∴ 200 ÷ 20
= 10 Ans.

Question 5.
Solution:
725 ÷ 23
725 is estimated to the nearest hundred = 700
23 is estimated to the nearest ten = 20
∴700 ÷ 20
= 35 Ans.

Question 6.
Solution:
275 ÷ 25
275 is estimated to the nearest hundred = 300
25 is estimated to the nearest ten = 30
∴ 300 ÷ 30
= 10 Ans.

Question 7.
Solution:
633 ÷ 33
633 is estimated to the nearest hundred = 600
33 is estimated to the nearest ten = 30
∴ 600 ÷ 30
= 20 Ans.

Question 8.
Solution:
729 ÷ 29
729 is estimated to the nearest hundred = 700
29 is estimated to the nearest ten = 30
∴ 700 ÷ 30
= 70 ÷ 3
= 23 (approximately) Ans.

Question 9.
Solution:
858 ÷ 39
858 is estimated to the nearest hundred = 900
39 is estimated to the nearest ten = 40
∴ 900 ÷ 40
= 90 ÷ 4
= 23 (approximately) Ans

Question 10.
Solution:
868 ÷ 38
868 is estimated to the nearest hundred = 900
38 is estimated to the nearest ten = 40
∴ 900 ÷ 40
= 90 ÷ 4
= 23 (approximately) Ans.

Hope given RS Aggarwal Solutions Class 6 Chapter 1 Number System Ex 1F are helpful to complete your math homework.

If you have any doubts, please comment below. Learn Insta try to provide online math tutoring for you.

RD Sharma Class 8 Solutions Chapter 27 Introduction to Graphs Ex 27.1

RD Sharma Class 8 Solutions Chapter 27 Introduction to Graphs Ex 27.1

These Solutions are part of RD Sharma Class 8 Solutions. Here we have given RD Sharma Class 8 Solutions Chapter 27 Introduction to Graphs Ex 27.1

Other Exercises

Question 1.
Plot the points (5,0 ), (5,1), (5, 8). Do they lie on a line ? What is your observation ?
Solution:
Draw XOX’ and YOY’ the co-ordinates axis on the graph.
Take 1 cm = 1 unit
Point A (5, 0), B (5, 1) and C (5, 8) have been plotted on the graph. By joining A, B and C, we see that these points lie on the same line which is 5 units from y-axis.
RD Sharma Class 8 Solutions Chapter 27 Introduction to Graphs Ex 27.1 1

Question 2.
Plot the points (2, 8), (7, 8) and (12, 8). Join these points in pairs. Do they lie on a line ? What do you observe ?
Solution:
Draw XOX’ and YOY’, the co-ordinate axis on the graph.
Take 0.5 cm = 1 unit.
Now points A (2, 8), B (7, 8), and C (12, 8) have been plotted on the graph. By joining them, we see that these points lie on the same line which is at a distance of 8 unit from x-axis.
RD Sharma Class 8 Solutions Chapter 27 Introduction to Graphs Ex 27.1 2

Question 3.
Locate the points :
(i) (1,1), (1,2), (1,3), (1,4)
(ii) (2,1), (2, 2), (2,3), (2,4)
(iii) (1,3), (2,3), (3,3), (4,3)
(iv) (1,4), (2,4), (3,4), (4,4).
Solution:
The points given in (i) and (ii) are locates in first graph.
RD Sharma Class 8 Solutions Chapter 27 Introduction to Graphs Ex 27.1 3
(i) (1,1), (1,2), (1,3), (1,4)
(ii) (2,1), (2, 2), (2, 3), (2, 4)
Points of (iii) and (iv) are located in the adjoining graph.
(iii) (1, 3), (2, 3), (3, 3), (4, 3)
(iv) (1,4), (2, 4), (3, 4), (4,4)
RD Sharma Class 8 Solutions Chapter 27 Introduction to Graphs Ex 27.1 4

Question 4.
Find the coordinates of points A, B, C, D in the figure
RD Sharma Class 8 Solutions Chapter 27 Introduction to Graphs Ex 27.1 5
Solution:
Draw perpendicular from A, B, C and D on x-axis and also on y-axis.
A is 1 unit from y-axis and 1 unit from x-axis.
∴ Co-ordinates of A are (1,1)
B is 1 unit fr onr y-axis and 4 units from x-axis
∴ Co-ordinates of B are (1,4)
C is 4 units from y-axis and 6 units from x-axis
∴ Co-ordinates of C are (4, 6)
D is 5 units fromy-axis and 3 units from x-axis
∴ Co-ordinates of D are (5,3)

Question 5.
Find the coordinates of points P, Q, R and S in Fig.
RD Sharma Class 8 Solutions Chapter 27 Introduction to Graphs Ex 27.1 6

Solution:
Through P, Q, R and S, draw perpendiculars on x-axis and also on y-axis.
(i) P is 10 units form >’-axis and 70 units from y-axis
∴ Co-ordinates of P are (10, 70)
(ii) Q is 12 unit from x-axis and 80 units from y-axis
∴ Co-ordinates of Q are (12, 80)
(iii) R is 16 units from x-axis and 100 units from y-axis
∴ Co-ordinates of R are (16, 100)
(iv) S is 20 units from x-axis and 120 units from y-axis
∴ Co-ordinates of S are (20, 120)

Question 6.
Write the coordinates of each of the vertices of each polygon in the figure.
RD Sharma Class 8 Solutions Chapter 27 Introduction to Graphs Ex 27.1 7
Solution:
(i) In figure OXYZ
Co-ordinates of O are (0, 0) ∵It is the origin
Co-ordinates of X are (0, 2) ∵ It lies on y – axis
Co-ordinates of Y are (2, 2)
Co-ordinates of Z are (2, 0) ∵It lies on x-axis
(ii) In figure ABCD, draw perpendicular from A, B, C, D on x-axis and y-axis.
A is 4 unit from y-axis and 5 units from x- axis
∴ Co-ordinates of A are (4, 5)
B is 7 units from y-axis and 5 units from x – axis
∴ Co-ordinates of B are (7, 5)
C is 6 units from y-axis and 3 units from x- axis
∴ Co-ordinates of C are (6, 3)
D is 3 units from y-axis as well x-axis
∴ Co-ordinates of D are (3, 3)
(iii) In figure PQR, perpendiculars for P, Q, R are drawn on x-axis and also on y-axis.
∴ Co-ordinates of P are (7, 4), of Q are (9, 5) and of R are (9, 3).

Question 7.
Decide which of the following statements is true and which is false. Give reasons for your answer.
(i) A point whose x-coordinate is zero, will lie on they-axis.
(ii) A point whose y-coordinate is zero, will lie on x-axis.
(iii) The coordinates of the origin are (0, 0).
(iv) Points whose x and y coordinates are equal, lie on a line passing through the origin.
Solution:
(i) Correct: ∵ every point on y-axis, its x = 0
(ii) Correct: ∵ every point on x-axis, its y = 0
(iii) Correct
(iv) Correct

Hope given RD Sharma Class 8 Solutions Chapter 27 Introduction to Graphs Ex 27.1 are helpful to complete your math homework.

If you have any doubts, please comment below. Learn Insta try to provide online math tutoring for you.