Learninsta presents the core concepts of Biology with high-quality research papers and topical review articles.
What is Biodiversity? Why Is It Important? Biodiversity Definition & Facts
The 1992 UN Earth Summit defined Biodiversity as the variability among living organisms from all sources, including terrestrial, marine and other aquatic ecosystems and the ecological complexes of which they are a part. This includes diversity within species, between species and ecosystems of a region. It reflects the number of different organisms and their relative frequencies in an ecological system and constitutes the most important functional component of a natural ecosystem.
It helps to maintain ecological processes, create soil, recycle nutrients, influence climate, degrade waste and control diseases. It provides an index of health of an ecosystem. The survival of human race depends on the existence and wellbeing of all life forms (plants and animals) in the biosphere.
Concept of biodiversity
The term biodiversity was introduced by Walter Rosen (1986). Biodiversity is the assemblage of different life forms. Each species is adapted to live in its specific environments. The changes in climatic conditions are reflected in the distribution and pattern of biodiversity on our planet.
The number of species per unit area declines as we move from tropics towards the poles. The Tundra and Taiga of northern Canada, Alaska, northern Europe and Russia possess less than 12 species of trees. The temperate forests of the United states have 20-35 species of trees, while the tropical forests of Panama have over 110 species of trees in a relatively small area.
Levels of biodiversity
Edward Wilson popularized the term ‘Biodiversity’ to describe diversity at all levels of biological organization from populations to biomes. There are three levels of biodiversity – Genetic diversity, Species diversity and Community/Ecosystem diversity (Fig. 11.1).
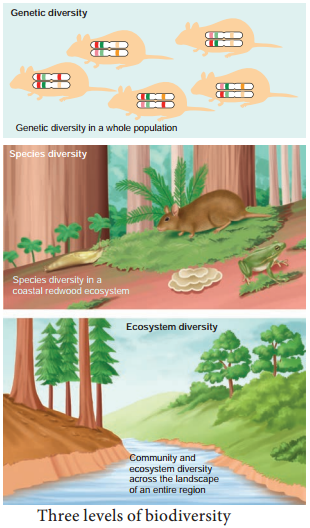
Genetic diversity refers to the differences in genetic make-up (number and types of genes) between distinct species and to the genetic variation within a single species; also covers genetic variation between distinct populations of the same species.
Genetic diversity can be measured using a variety of molecular techniques. India has more than 50,000 genetic variants of Paddy and 1000 variants of Mango. Variation of genes of a species increases with diversity in size and habitat.
It results in the formation of different races, varieties and subspecies. Rouwolfia vomitaria, a medicinal plant growing in different ranges of the Himalayas shows differences in the potency and concentration of the active ingredient reserpine due to genetic diversity. Genetic diversity helps in developing adaptations to changing environmental conditions.
Species diversity refers to the variety in number and richness of the species in any habitat. The number of species per unit area at a specific time is called species richness, which denotes the measure of species diversity.
The Western Ghats have greater amphibian species diversity than the Eastern Ghats. The more the number of species in an area the more is the species richness (Fig. 11.1 a). The three indices of diversity are – Alpha, Beta and Gamma diversity.
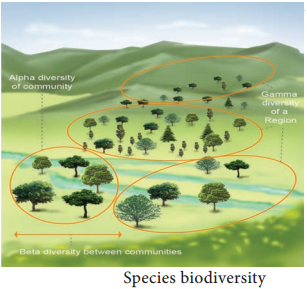
(i) Alpha diversity:
It is measured by counting the number of taxa (usually species) within a particular area, community or ecosystem.
(ii) Beta diversity:
It is species diversity between two adjacent ecosystems and is obtaining by comparing the number of species unique to each of the ecosystem.
(iii) Gamma diversity:
Gamma diversity refers to the diversity of the habitats over the total landscape or geographical area. Community/Ecosystem diversity is the variety of habitats, biotic communities, and ecological processes in the biosphere.
It is the diversity at ecosystem level due to diversity of niches, trophic levels and ecological processes like nutrient cycles, food webs, energy flow and several biotic interactions. India with its alpine meadows, rain forests, mangroves, coral reefs, grass lands and deserts has one of the greatest ecosystem diversity on earth.
Magnitude of biodiversity
Biodiversity is often quantified as the number of species in a region at a given time. The current estimate of different species on earth is around 8-9 million. However, we really don’t know the exact magnitude of our natural wealth.
This is called the ‘The Taxonomic impediment’. So far about 1.5 million species of microorganisms, animals and plants have been described. Each year about 10-15 thousand new species are identified and published worldwide, of which 75% are invertebrates. The number of undescribed species is undoubtedly much higher.
India is very rich in terms of biological diversity due to its unique bio-geographical location, diversified climatic conditions and enormous eco-diversity and geo-diversity. According to world biogeographic classification, India represents two of the major realms (The Palearctic and Indo-Malayan) and three biomes (Tropical humid forests, Tropical Dry/Deciduous forests and Warm Deserts/Semi deserts). With only about 2.4% of the world’s total land surface, India is known to have over 8 % of the species of animals that the world holds and this percentage accounts for about 92,000 known species.
India is the seventh largest country in the world in terms of area. India has a variety of ecosystems, biomes with its varied habitats like, hills, valleys, plateaus, sea shores, mangroves, estuaries, glaciers, grasslands and river basins.
It also reflects different kinds of climates, precipitation, temperature distribution, river flow and soil. India is one of the 17 mega biodiversity countries of the world and has ten biogeographic zones with characteristic habitat and biota.
Patterns of biodiversity distribution
The distribution of plants and animals is not uniform around the world. Organisms require different sets of conditions for their optimum metabolism and growth. Within this optimal range (habitat) a large number and type of organisms are likely to occur, grow and multiply. The habitat conditions are determined by their latitudes and altitudes.
Latitudinal and altitudinal gradients:
Temperature, precipitation, distance from the equator (latitudinal gradient), altitude from sea level (altitudinal gradient) are some of the factors that determine biodiversity distribution patterns. The most important pattern of biodiversity is latitudinal gradient in diversity. This means that there is an increasing diversity from the poles to equator.
Diversity increases as one moves towards the temperate zones and reaches the maximum at the tropics. This, tropics harbour more biodiversity than temperate or polar regions, especially between the latitudes of 23.5°N and 23.5°S (Tropic of Cancer to the Tropic of Capricorn). Harsh conditions exist in temperate areas during the cold seasons while very harsh conditions prevail for most of the year in polar regions.
Columbia located near the equator (0°) has nearly 1400 species of birds while New York at 41°N has 105 species and Greenland at 71°N has 56 species. India, with much of its land area in the tropical latitudes, is home for more than 1200 species of birds. This it is evident that the latitude increases the species diversity.
Decrease in species diversity occurs as one ascends a high mountain due to drop in temperature (temperature decreases @ 6.5°C per Km above mean sea level). The reasons for the richness of biodiversity in the Tropics are:
- Warm tropical regions between the tropic of Cancer and Capricorn on either side of equator possess congenial habitats for living organisms.
- Environmental conditions of the tropics are favourable not only for speciation but also for supporting both variety and number of organisms.
- The temperatures vary between 25°C to 35°C, a range in which most metabolic activities of living organisms occur with ease and efficiency.
- The average rainfall is often more than 200 mm per year.
- Climate, seasons, temperature, humidity, photoperiods are more or less stable and encourage both variety and numbers.
- Rich resource and nutrient availability.
Species – Area relationships
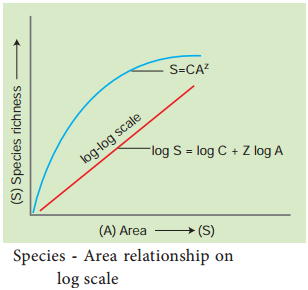
German Naturalist and Geographer Alexander von Humboldt explored the wilderness of south American jungles and found that within a region the species richness increased with increasing area but upto a certain limit. The relationship between species richness and area for a wide variety of taxa (angiosperm plants, birds, bats, freshwater fishes) turned out to be the rectangular hyperbola. On a logarithmic scale, the relationship is a straight line described by the equation.
log S = log C + Z log A
where
S = Species richness
A = Area
Z = Slope of the line (regression coefficient)
C = Y – intercept
Regression coefficient Z generally has a value of 0.1-0.2 regardless of taxonomic group or region. However, in case of the species – area relationship in very large areas like entire continents, the slope of the line appears to be much steeper (Z-value in the range of 0.6-1.2). For example, in case of the fruit eating (frugivorous) birds and mammals in the tropical forests of different continents, the slope is found to be a steeper line of 1.15 (Fig. 11.2).