RS Aggarwal Class 8 Solutions Chapter 22 Constructing and Interpreting Bar Graphs Ex 22
These Solutions are part of RS Aggarwal Solutions Class 8. Here we have given RS Aggarwal Class 8 Solutions Chapter 22 Constructing and Interpreting Bar Graphs Ex 22.
Question 1.
Solution:
We can draw the bar graph by the following steps :
(i) On the graph draw one horizontal line OX and other vertical line OY representing x-axis and y-axis respectively.
(ii) Along x-axis, write the name of subjects taken at uniform gaps.
(iii) Choose the scale = 1 small division = 1 mark
(vi) Then the heights of various bars will be drawn as shown on the graph.
Question 2.
Solution:
We can draw the bar graph by the following steps :
(i) On the graph paper, draw a horizontal line OX and another vertical line OY representing x-axis and y-axis respectively.
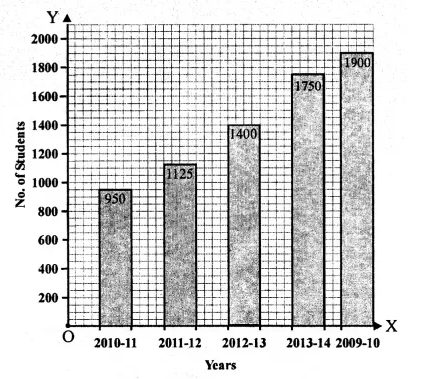
(ii) Along the x-axis write the years taken on uniform gaps.
(iii) Choose scale : 1 small division = 20 students
(iv) Then the heights of various bars will be drawn as shown on the graph.
Question 3.
Solution:
We can draw the bar graph by the following steps :
(i) On the graph paper, draw a horizontal line OX and another vertical line OY representing x-axis and y-axis respectively.
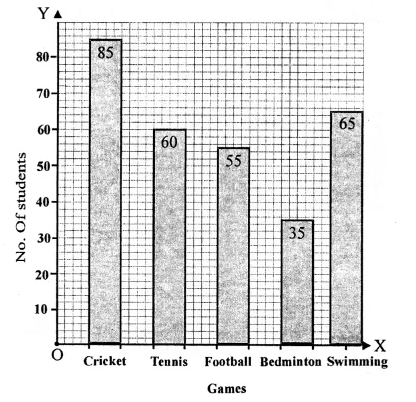
(ii) Along the x-axis, write the names of sports taken on uniform gaps.
(iii) Choose the scale : 1 small division = 1 student
(iv) Then the heights of various bars will be drawn as shown on the graph
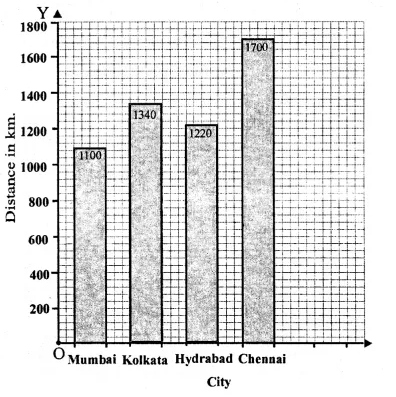
Question 4.
Solution:
We can draw the bar graph by the following steps :
(i) On the graph, draw a horizontal line OX and another vertical line OY representing x-axis and y-axis respectively.
(ii) Along x-axis, write cities with a uniform gaps.
(iii) Choose the scale : 1 small division = 200 km
(iv) Then we shall draw the heights of various bars as shown on the graph.
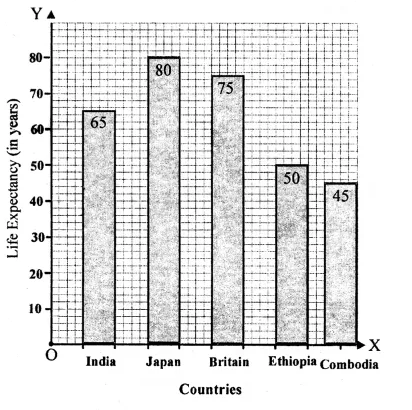
Question 5.
Solution:
We can draw the bar graph by the following steps :
(i) On the graph, draw a horizontal line OX and another vertical line OY representing x-axis and y-axis respectively.
(ii) Along x-axis, write countries
(iii) Choose the scale : 1 small division = 10 year
(iv) Then we shall draw the heights of various bars as shown on the graph.
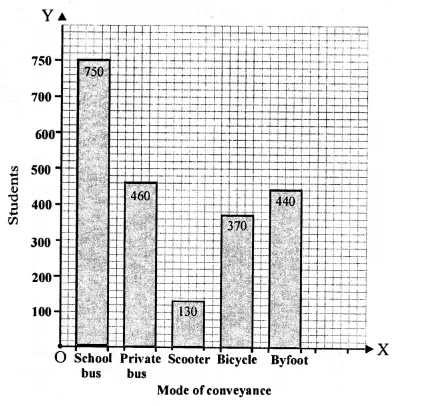
Question 6.
Solution:
We can draw a bar graph by the following steps :
(i) On the graph, draw a horizontal line OX and another vertical line OY representing x-axis and y-axis respectively.
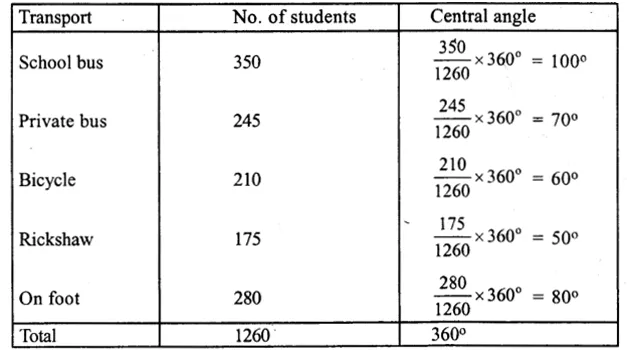
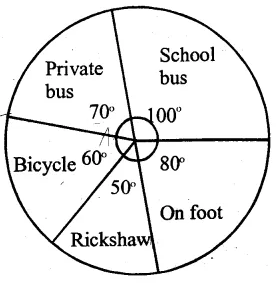
(ii) Along x-axis, write modes of transport with uniform gaps.
(iii) Choose the scale : 1 small division = 100 Students
(iv) Then we shall draw the heights of bars as shown on the graph.
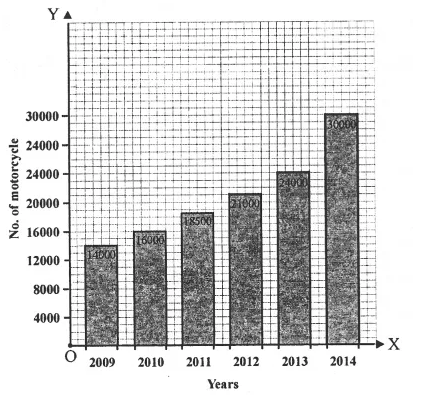
Question 7.
Solution:
(i) Draw a horizontal line OX and a vertical line OY which represent x-axis and y-axis respectively on the graph.
(ii) Along OX, write years and along OY, number of motorcycles.
(iii) Choose 1 division = 300
(iv) Now draw bars of different heights according to give data as shown on the graph.
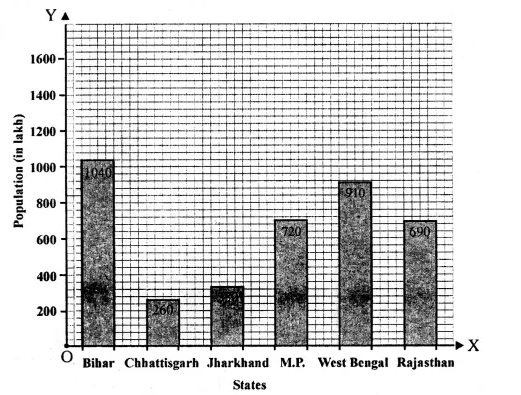
Question 8.
Solution:
We can draw the bar graph by the following steps :
(i) On the graph, draw horizontal line OX and another vertical line OY representing x-axis and y-axis respectively.
(ii) Along x-axis, write the names of States given at uniform gaps.
(iii) Choose scale : 1 small division = 200 lakhs
(iv) Then we shall draw the heights of various bars as shown on the graph.
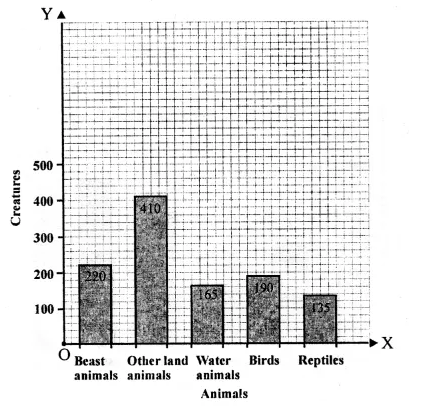
Question 9.
Solution:
We can draw the bar graph by the following steps :
(i) On the graph, draw horizontal line OX and another vertical line OY representing x-axis
and y-axis respectively.
(ii) Along x-axis, write the names of animals given at uniform gaps.
(iii) Choose scale : 1 small division = 200 lakhs
(iv) Then we shall draw the heights of various bars as shown on the graph.
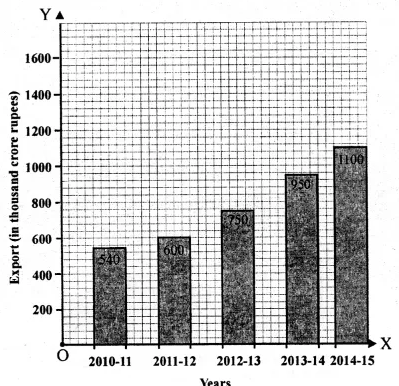
Question 10.
Solution:
We can draw the bar graph by the following steps :
(i) On the graph paper, draw a horizontal line OX and another vertical line OY representing x-axis and y-axis respectively.
(ii) Along the x-axis write the years taken on uniform gaps.
(iii) Choose scale : 1 small division = 20 export earnings
(iv) Then the heights of various bars will be drawn as shown on the graph.
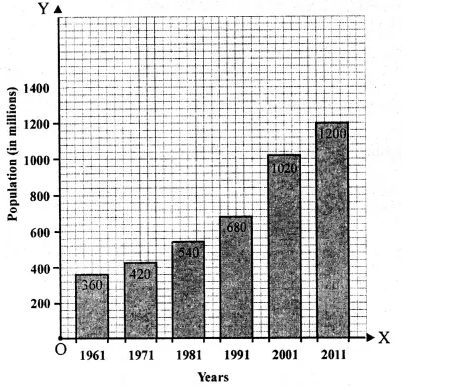
Question 11.
Solution:
We can draw the bar graph by the following steps :
(i) On the graph, draw horizontal line OX and another vertical line OY representing x-axis and y-axis respectively.
(ii) Along x-axis, write the names of years given at uniform gaps.
(iii) Choose scale 1 small division = 200 lakhs
(iv) Then we shall draw the heights of various bars as shown on the graph.
Question 12.
Solution:
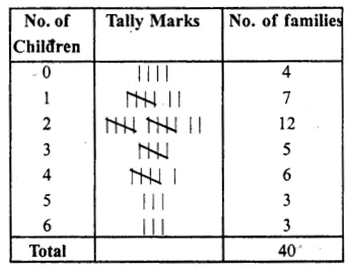
(i) The bar graph shows the number of members in each of the 100 families of a village.
(ii) 90
(iii) 65
(iv) 5
Question 13.
Solution:
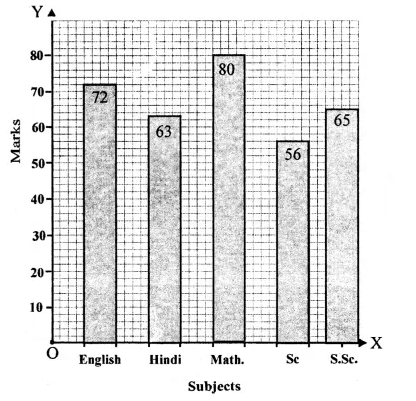
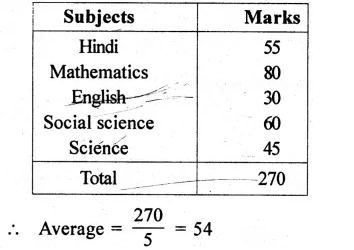
(i) The given bar graph shows the marks obtained by a student in an examination in each of the five subjec ts.
(ii) English.
(iii) From the given graph,
(iv) Mathematics.
Question 14.
Solution:
(i) Mount Everest is the heighest peak and its heights is 8800 m.
(ii) Highest peak is Mount Everest and lowest peak is Annapurna and their heights are 8800 m and 6000 m respectively.
Ratio = 8800 : 6000 => 22 : 15
(iii) Heights of peaks in ascending order is 6000 m, 7500 m, 8000 m, 8200 m and 8800 m.
(iv) Kanchenjunga peak differ by 600 meter from Mount Everest.
Hope given RS Aggarwal Class 8 Solutions Chapter 22 Constructing and Interpreting Bar Graphs Ex 22 are helpful to complete your math homework.
If you have any doubts, please comment below. Learn Insta try to provide online math tutoring for you.