By going through these CBSE Class 11 Maths Notes Chapter 15 Statistics Class 11 Notes, students can recall all the concepts quickly.
Statistics Notes Class 11 Maths Chapter 15
Before we discuss about the measure of deviations, we are expected to know how to calculate arithmetic mean \(\bar{x}\) and median.
To find mean of a distribution, we proceeded as :
For ungrouped data : x1, x1 …….. xn.
\(\bar{x}=\frac{x_{1}+x_{2}+\ldots+x_{n}}{n}=\frac{\Sigma x_{i}}{n}\)
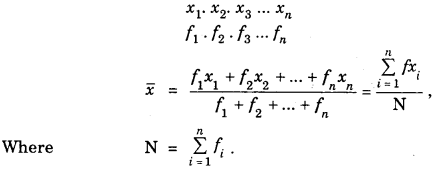
For discrete frequency distribution
For Continuous Frequency distribution : Let a be the assumed mean.
∴ di = xi – a, h = class interval
and N = Total frequency = f1 + f2 + … fn
Then \(\bar{x}=a+\left(\frac{\Sigma f_{i} d_{i}}{N}\right) \times h\)
To calculate the median, the process is as follows :
For ungrouped data : Arrange the data in ascending or descending order.
If n is odd, \(\left(\frac{n+1}{2}\right)\) th value = Median
If n is even \(\frac{1}{2}\left[\frac{n}{2} \text { th value }+\left(\frac{n}{2}+1\right)^{\text {th }} \text { value }\right]\) = Median
Same method is adopted in case of discrete frequency distribution.
For continuous frequency distribution:
(i) Find the cumulative frequencies :
(ii) \(\frac{\mathrm{N}}{2}\)th or next of \(\frac{\mathrm{N}}{2}\)th cumulative frequency correspond to median class.
(iii) Cumulative frequency C just before \(\frac{\mathrm{N}}{2}\)th c.f. is denoted by C.
(iv) l = lower limit of median class
h = class interval of median class
f= frequency corresponding to median class
Then, median = M = l + \(\left(\frac{\frac{N}{2}-C}{f}\right)\)x h
Measures of dispersion are required to study the degree of scattemess of observations from the central value. The central value may be mean (or median).
Mean deviation from the mean : If a set of n observations x1 x2, … xn have their mean \(\bar{x}\), then mean deviation from the mean \(\bar{x}=\frac{\sum_{i=1}^{n}\left|x_{i}-\bar{x}\right|}{n}\) , where |xi – \(\bar{x}\)| is the abosolute value of the deviation of xi from\(\bar{x}\) .
In case, the distribution is a grouped one, the mean deviation from the mean is given by
M.D \((\bar{x})=\frac{\sum_{i=1}^{k} f_{i}\left|x_{i}-\bar{x}\right|}{\sum_{i=1}^{k} f_{i}}\)
where k is the number of classes.
Mean deviation from the median : If a set of n observations are x1, x2, x3, ………….xn, then mean deviation from the median = M.D. (Med.)
= \(\frac{\Sigma \mid x_{i}-\text { Median } \mid}{n}\)
In case of grouped data, M.D. (Med.) = \(\frac{\Sigma f_{i} \mid x_{i}-\text { Median } \mid}{\Sigma f_{i}}\)
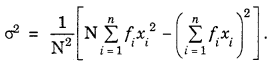
Variance and Standard Deviation: In case of mean deviation from the mean, we take the absolute values of the deviations from the mean, so that their sum does not become zero. Another way is to find the square of the deviations and then add up. It may be possible that \(\sum_{i=1}^{n}\left(x_{i}-\bar{x}\right)^{2}\) in case of distributions having large number of observations but small deviations may be larger than that in case of a distribution having small number of observations but larger deviations which may not be true. As such, to overcome this difficulty, we take average of the squares of deviations.
Thus, variance = \(\frac{\sum_{i=1}^{n}\left(x_{i}-\bar{x}\right)^{2}}{n}\) and standard deviation = σ = \(\sqrt{\text { variance }}=\sqrt{\frac{\Sigma\left(x_{i}-\bar{x}\right)^{2}}{n}} .\)
Short-cut Method to Calculate Variance for discrete frequency distribution :
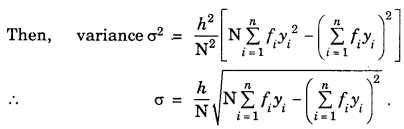
For continuous frequency distribution : Let a be the assumed mean and h be the class interval.
Now, we calculate the variable, yi as
yi = \(\frac{x_{i}-a}{h}\)
Comparison of variability of distribution : To compare the variability of two or more distributions, we calculate the coefficient of variation of each distribution, i.e.,
Coefficient of variance (C.V.)
= \(\frac{\text { Standard Deviation }}{\text { Mean }}\) x 100
= \(\frac{\sigma}{x}\) x 100
Greater is the value of coefficient of variation of a distribution, there is more variability in that distribution.