RS Aggarwal Class 7 Solutions Chapter 22 Bar Graphs Ex 22
These Solutions are part of RS Aggarwal Solutions Class 7. Here we have given RS Aggarwal Solutions Class 7 Chapter 22 Bar Graphs Ex 22.
Question 1.
Solution:
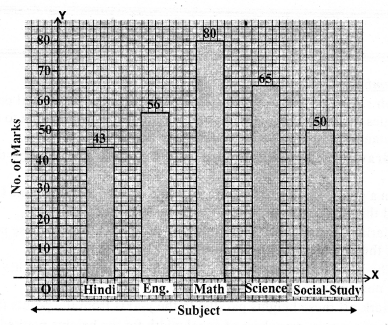
(i) Draw a horizontal line OX and a vertical line OY on the graph representing x-axis and y-axis.
(ii) Along OX, mark subjects and along y-axis, mark, number of marks
(iii) Take one division = 10 marks.
Now we shall draw bar graph as shown.
Question 2.
Solution:
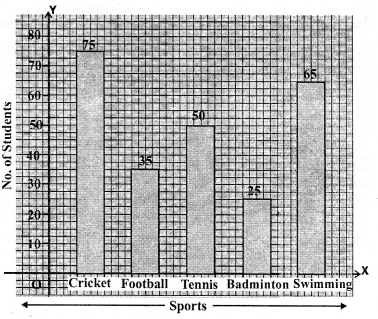
(i) Draw a horizontal line OX and a vertical line OY on the graph paper. These two lines represent x-axis and y-axis respectively.
(ii) Along OX, write sports and along OY, number of students choosing on division equal to 10 students.
(iii) Now draw the bars of various heights according to the no. of students as shown on the graph.
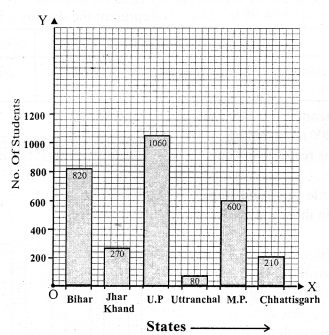
Question 3.
Solution:
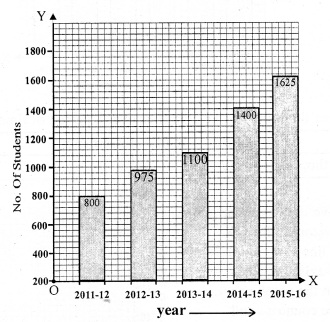
(i) Draw a horizontal line OX and a vertical line OY. These represent x-axis and y-axis respectively on the graph paper.
(ii) Along OX, write years and along OY, no. of students choosing one division = 200 students.
(iii) Draw bars of various heights according to the number of students given.
This is the required bar graph as shown.
Question 4.
Solution:
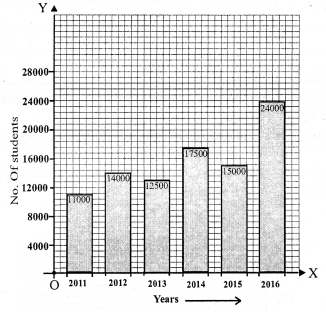
(i) Draw a horizontal line OX and a vertical line OY which represent x-axis and y-axis respectively on the graph.
(ii) Along OX, write years and along OY, no. of scooters
(iii) Choose 1 division = 300
(iv) Now draw bars of different heights according to given data as shown on the graph.
Question 5.
Solution:
(i) Draw a horizontal line OX and a vertical line OY representing x-axis and y-axis respectively on the graph paper.
(ii) Along OX write countries and along OY, take Birth rate per thousand.
(iii) Choose 1 division = 10.
(iv) Now draw bars of different heights according to the given data as shown on the graph.
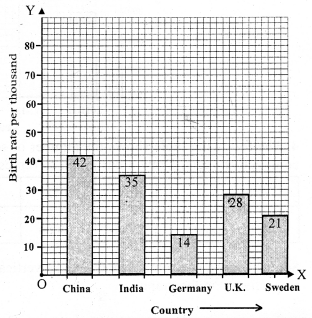
Question 6.
Solution:
(i) Draw a horizontal line OX and a vertical line OY representing x-axis and y-axis on the graph paper.
(ii) Along x-axis write states and along y-axis population in lakhs.
(iii) Choose one division = 200 (Lakhs)
(iv) Draw bars of different heights according to the data given as shown on the graph.
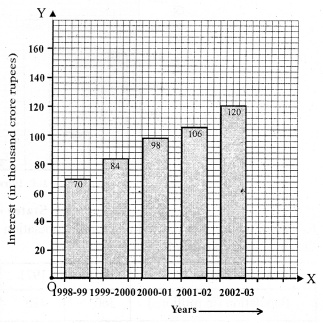
Question 7.
Solution:
(i) Draw a horizontal line OX and a vertical line OY representing x-axis and y-axis respectively on the graph paper.
(ii) Along x-axis write years and along y-axis Interest in thousand cores rupees.
(iii) Choose one division = 20 thousand crore rupees.
(iv) Draw bars of different heights according to the given data as shown on the graph.
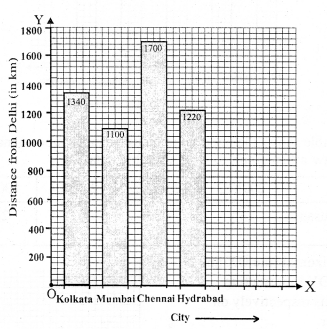
Question 8.
Solution:
(i) Draw a horizontal line OX and a vertical line OY representing x-axis and y-axis respectively on the graph paper.
(ii) Along x-axis, write city and along y-axis the distance (in km).
(iii) Choose one division = 200 km.
(iv) Draw bars of different heights according to the given data as shown on the graph.
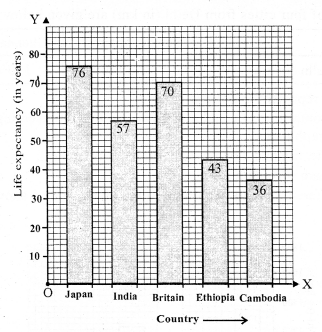
Question 9.
Solution:
(i) Draw a horizontal line OX and a vertical line OY represent x-axis and y-axis respectively on the graph paper.
(i) Along x-axis write countries and along y-axis life expectancy (in years)
(ii) Choose one division = 10 years
(iv) Draw bars of different heights according to the given data as shown on the graph.
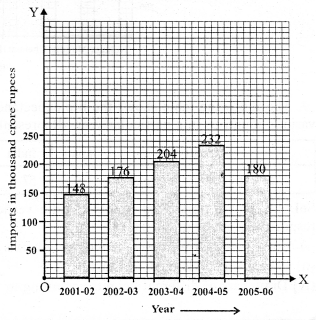
Question 10.
Solution:
(i) Draw a horizontal line OX and a vertical line OY representing x-axis and y-axis respectively on the graph paper.
(ii) Along x-axis write years and along y-axis imports in thousand crores rupees.
(iii) Choose one division = 50 thousand crore rupees.
(iv) Draw bars of different heights according to the given data as shown on the graph.
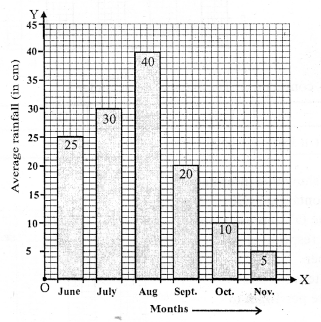
Question 11.
Solution:
(i) Draw a horizontal line OX and a vertical line OY representing x-axis and y-axis respectively on the graph paper.
(ii) Along x-axis write months and along y-axis average rainfall in cm.
(iii) Choose one small division = 5cm.
(iv) Draw different bars of different heights according to the given data as shown on the graph.
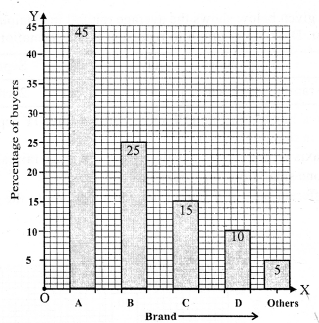
Question 12.
Solution:
(i) Draw a horizontal line OX and a vertical line OY representing x-axis and y-axis respectively on the graph paper.
(ii) Along x-axis write Brand and along y-axis, percentage of buyers.
(iii) Choose one division = 5% of buyers.
(iv) Draw bars of different heights according to the given data, as shown on the graph.
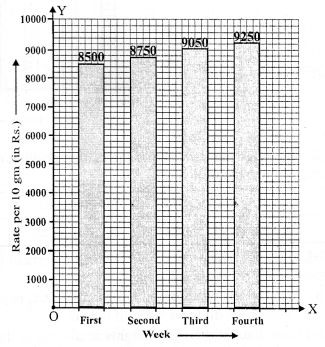
Question 13.
Solution:
(i) Draw a horizontal line OX and a vertical line OY representing x-axis and y-axis respectively on the graph paper.
(ii) Along x-axis, write week and along y-axis. Rate per 10gm in rupees.
(iii) Choose and division = 1000
(iv) Draw bars of different heights according to the data given as shown on the graph.
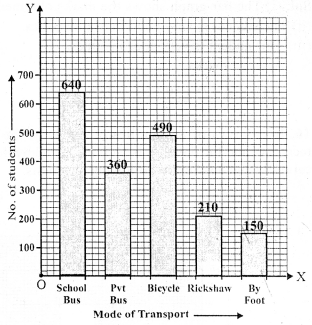
Question 14.
Solution:
(i) Draw a horizontal line OX and a vertical line OY representing x-axis and y-axis respectively on the graph paper.
(ii) Along x-axis, write mode of transport and on the y-axis is number of students.
(iii) Choose one division =100 students
(iv) Draw bars of different heights according to given data as shown on the graph.
Question 15.
Solution:
(i) The bar graph shows the marks obtained by a student in different subjects.
(ii) The student is very good in Mathematics.
(iii) The student is very poor in Hindi.
(iv) Average marks
![]()
Question 16.
Solution:
(i) The bar graph shows the number of members in each of the 85 families.
(ii) 40 families have 3 number each.
(iii) Number of people living alone is nil.
(iv) The families having 3 members each is most common.
Question 17.
Solution:
(i) The highest peak is Mount Everest whose heighest is 8800 m.
(ii) The required ratio between the highest peak and the next heighest peak = 8800 : 8200 or 44 : 41
(iii) Arranging the heights of peaks in descending order are : 8800 m, 8200 m, 8000 m, 7500 m, 6000 m
Question 18.
Solution:
(i) We can draw the double bar graph in the following steps :
(a) On a graph paper, draw a horizontal line OX and a vertical line OY, representing the x-axis and the y-axis respectively.
(b) Along OX, write the names of the subjects taken at appropriate uniform gaps.
(c) Choose the scale : 1 division = 10
(d) The heights of various pairs of bars in terms of the number of small divisions are :
Mon. 350 and 200; Tues. 400 and 450; Wed. 500 and 300; Thurs. 450 and 250; Fri. 550 and 100 and Sat. 450 and 50.
(e) On the x-axis, draw pairs of bars of equal width and of heights shown in step 4 at the points marked in step 2.
(ii) The number of readers in the library was maximum on TUESDAY.
(iii) Total Number of magazine readers in a week = 200 + 450 + 300 + 250 + 100 + 50 = 1350
Mean Number of readers per day = \(\frac { 1350 }{ 6 }\) = 225
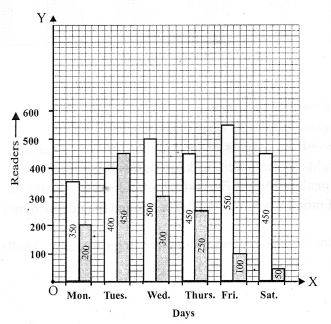
Question 19.
Solution:
(i) We can draw the double bar graph in the following steps :
(a) On a graph paper, draw a horizontal line OX and a vertical line OY, representing the x-axis and the y-axis respectively.
(b) Along OX, write the names of the subjects taken at appropriate uniform gaps.
(c) Choose the scale: 1 division = 4
(d) The heights of various pairs of bars in terms of the number of small divisions are:
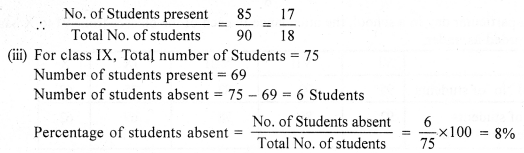
VI 95 and 92; VII 90 and 85; VIII 82 and 78; IX 75 and 69; X 68 and 62.
(e) On the x-axis, draw pairs of bars of equal width and of heights shown in step 4 at the points marked in step 2.
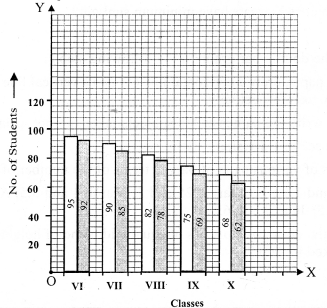
(ii) For class VII, total Number of Students = 90
Number of students present = 85
Question 20.
Solution:
(i) We can draw the double bar graph in the following steps :
(a) On a graph paper, draw a horizontal line OX and a vertical line OY, representing the x-axis and the y-axis respectively.
(b) Along OX, write the names of the subjects taken at appropriate uniform gaps.
(c) Choose the scale: 1 division = 10
(d) The heights of various pairs of bars in terms of the number of small divisions are:
January 2 and 1.5 ; February 3.25 and 3; March 4 and 3.5; April 4.5 and 6; May 7.75 and 5.5; June 8 and 6.5.
(e) On the x-axis, draw pairs of bars of equal width and of heights shown in step 4 at the points marked in step 2.
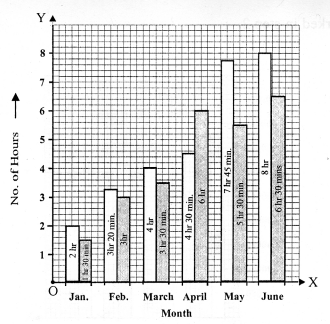
(ii) June
(iii) January
Question 21.
Solution:
(i) We can draw the double bar graph in the following steps :
(a) On a graph paper, draw a horizontal line OX and a vertical line OY, representing the x-axis and the y’-axis respectively.
(b) Along OX, write the names of the subjects taken at appropriate uniform gaps.
(c) Choose the scale: 1 division = 10
(d) The heights of various pairs of bars in terms of the number of small divisions are:
Town A 640000 and 750000; Town B 830000 and 920000; Town C 460000 and 630000; Town D 290000 and 320000
(e) On the x-axis, draw pairs of bars of equal width and of heights shown in step 4 at the points marked in step 2.
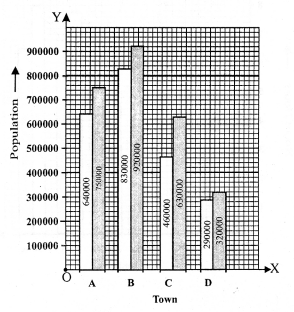
(ii) Town B
(iii) Town D
Hope given RS Aggarwal Solutions Class 7 Chapter 22 Bar Graphs Ex 22 are helpful to complete your math homework.
If you have any doubts, please comment below. Learn Insta try to provide online math tutoring for you.