By going through these CBSE Class 12 Accountancy Notes Chapter 10 Accounting Ratios, students can recall all the concepts quickly.
Accounting Ratios Notes Class 12 Accountancy Chapter 10
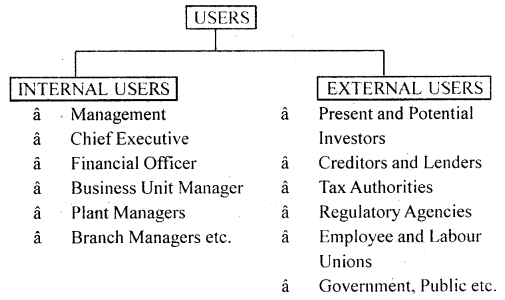
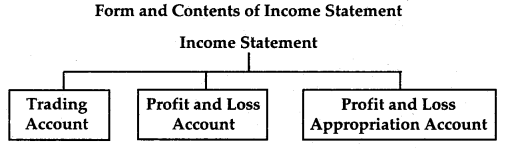
As we know that, the financial statements are prepared to meet the common information needs of users of information. Financial Statements include:
- Income Statement or Profit & Loss A/c
- Position Statement or Balance Sheet
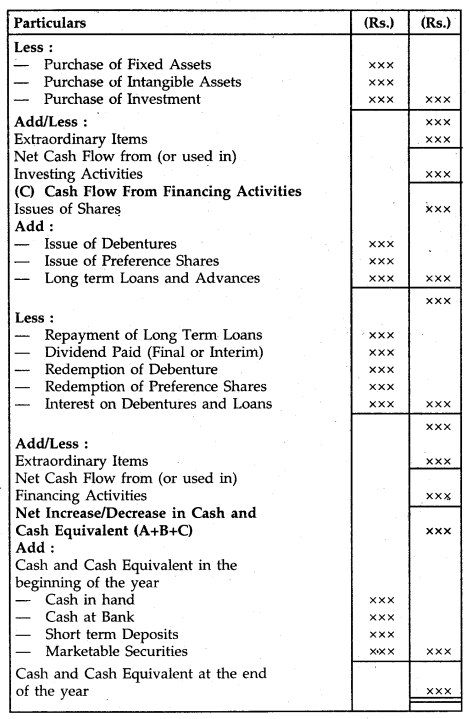
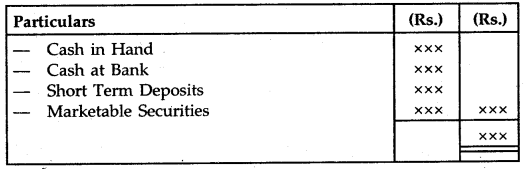
- Cash Flow Statement.
→ “The first and most important function of financial statements is, of course, to serve those who control and direct the business, to the end of securing the profits and maintaining a sound financial condition.” -Harry Guthman
The financial statement analysis is of much interest to a number of groups of persons. This analysis is done through the various tools
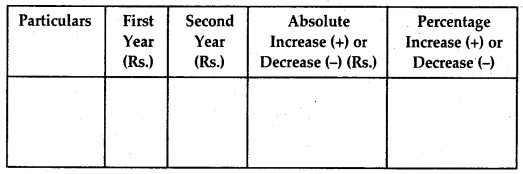
- Comparative Statement
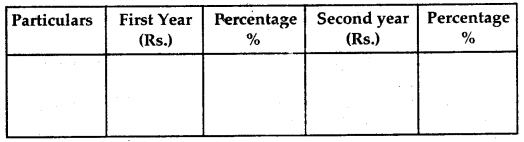
- Common Size Statements
- Trend Analysis
- Ratio Analysis etc.
These tools of analysis help to understand the financial state of a business in a better manner. The analysis comprises resolving the statements by breaking them into simpler statements by a process of rearranging and regrouping different items. Thus, analysis is the mental process of understanding the terms of such statements and forming opinions or inferences about the financial health, profitability, efficiency, and such other aspects of the company.
Meaning of Ratio-Analysis:
Ratio analysis is the most important and popular tool of financial analysis. It is a combination of two terms ‘ratio’ and ‘analysis. A ‘ratio’ is an arithmetic expression of the relationship between two variables. Two variables must be significantly related to producing meaningful results. ‘Accounting Ratios’ are computed by taking data from the financial statements of business entities and express the relationship between two financial variables from the financial statements.
In other words, the Accounting ratio is the arithmetical relationship between two accounting variables but they assume significance if these variables have cause and effect relationships.
The accounting ratio provides a quantitative relationship that the analyst may use to make a qualitative judgment about various aspects of the financial position and performance of an enterprise.
→ “The term accounting ratio is used to describe the significant relationship which exists between>figures shown in a balance sheet, in a profit and loss account, in a budgetary control system or in any part of the accounting organization.” – J. Betty
Accounting Ratios express the relationship between two financial variables of the financial statements. They may be expressed in either of the following ways.
→ Pure or in Proportion: In this, the relationship between two items is directly expressed in proportion.
→ Percentage: In this, a quotient obtained by dividing one figure by another is multiplied by 100 and it becomes the ‘percentage’ form of expression.
→ Time: It is expressed a number of times a particular figure is compared to another figure.
→ Fraction: It is expressed infraction. For example, net profit is 1/4th of sales.
Objectives of Ratio Analysis
- To simplify the comprehension of financial statements and to summarise a large number of figures.
- To highlight the changes in the financial position of the business.
- To facilitate intra-firm comparison of the performance of the different divisions of the firm.
- To facilitate inter-firm comparison.
- To facilitate planning and control and thus decision-making.
Advantages of Ratio Analysis:
1. Useful in the analysis of financial statements:
It is easy to understand the financial position of a business enterprise in respect of short-term solvency, capital structure position, etc; with the help of various ratios.
2. Useful in judging the operating efficiency of business:
Ratio enables the users of financial information to determine the operating efficiency of business firms by relating the profit figures to the capital employed for a given period.
3. Useful in simplifying accounting figures:
“Financial Ratios are useful because they summarise briefly the results of detailed and complicated computation.” Birman and Dribin Ratios help in simplifying complex accounting figures and bring out their relationships. They help to summarize the financial information effectively.
4. Useful in Inter-firm and Intra-firm comparison:
With the help of ratios, a firm can compare its performance with that of other firms and of industry in general.
The ratio also helps firm to compare the performance of different units belonging to the same firm. Even the progress of a firm from year to year cannot be measured without the help of ratios.
5. Useful in Comparative analysis:
The ratios need not be calculated for one year only. When many years figures are kept side by side, they help a great deal in exploring the trend visible in the business.
6. Useful in locating the weak spots (problem areas) of the business:
Ratios help businesses in identifying the problem areas as well as the bright areas of the business. Problem areas would need more attention and bright areas will need polishing to have still better results.
7. Useful in SWOT (Strength-Weakness-Opportunity-Threat) analysis:
Ratios help a great deal in explaining the changes occurring in the business. The information of change helps the management a great deal in understanding the current threats and opportunities and allows the business to do its own SWOT analysis.
Limitations of Ratio Analysis
1. Ratio ignores qualitative factors: The ratios are obtained from the figures expressed in money. In this way, qualitative factors, which may be important, are ignored.
2. Defective accounting information: The ratios are calculated from the accounting data in the financial statements. It means that defective information would give the wrong ratio.
3. Ignores Price-Level Changes: Change in price level affects the comparability of ratios. But no consideration is given to price level changes in the accounting variables from which ratios are computed. This really affects the utility of ratios.
4. Change in accounting procedures: A comparison of results of two firms becomes difficult when we find that these firms are using different procedures in respect of certain items.
5. Variations are general operating conditions: While interpreting the results based on ratio analysis, all business enterprises have to work within given general economic conditions, conditions of the industry in which the firms operate, and the position of individual companies within the industry.
6. Means and not the end: Ratios are means to an end rather than the end itself.
7. Lack of ability to resolve problems: The ratios have a lack of ability to solve the problems arising due course of business.
8. Lack of standardized definitions: There is a lack of standardized definitions of various concepts used in ratio analysis. There are only generally accepted forms available in the literature.
9. Lack of universally accepted standard levels: There is no universal yardstick that specifies the level of ratio which is acceptable.
10. Ratio based on unrelated figures: A ratio may be calculated for unrelated figures which would essentially be a meaningless exercise.
Types of Ratios
On the basis of financial statements:
1. Income Statement Ratios: A ratio of two variables from the income statement is known as Income Statement Ratio. For example, the ratio of gross profit to sales known as gross profit ratio is calculated using both figures from the income statement.
2. Balance Sheet Ratios: In case both variables are from the balance sheet, it is classified as Balance Sheet Ratios. For example, the ratio of current assets to current liabilities known as the current ratio is calculated using both figures from the balance sheet.
3. Composite Ratios: If a ratio is computed with one variable from the income statement and another variable from the balance sheet, it is called a composite ratio. For example, the ratio of credit sales to debtors and bills receivable known as debtors turnover ratio is calculated using one figure from the income statement (credit sales) and another figure from the balance sheet (Debtors and Bills receivable).
Ratios, as tools for establishing true profitability and financial position of a business, maybe classified as:
1. Liquidity Ratios: It measures the short-term solvency i.e. the firm’s ability to pay its current dues.
2. Solvency Ratios: These ratios are computed to judge the ability of a firm to pay off its long-term liabilities. It shows the proportion of the fund which is provided by outside creditors in comparison to owners.
3. Activity (or Turnover) Ratios: Activity ratios are used to indicate the efficiency with which assets such as stock, debtors, fixed assets, etc. of the firm are being utilized. These ratios are also known as a Turnover ratio because they indicate the speed with which assets are being converted or turned over into sales.
4. Profitability Ratios: The efficiency of a business is measured in terms of profits. Thus, profitability ratios are computed to measures the efficiency of a business.
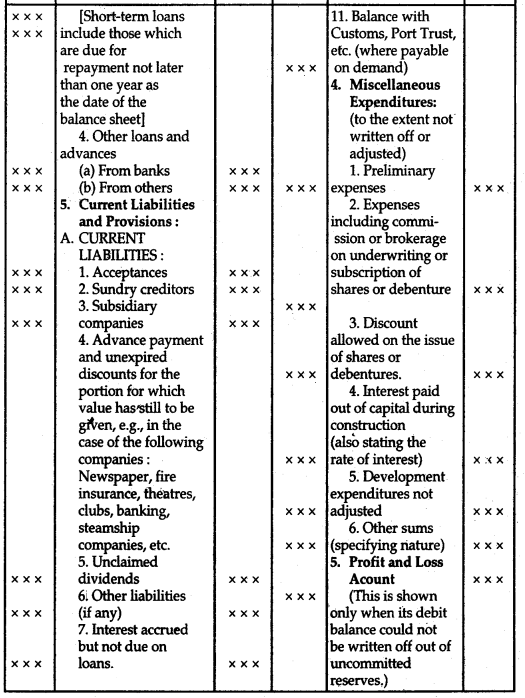
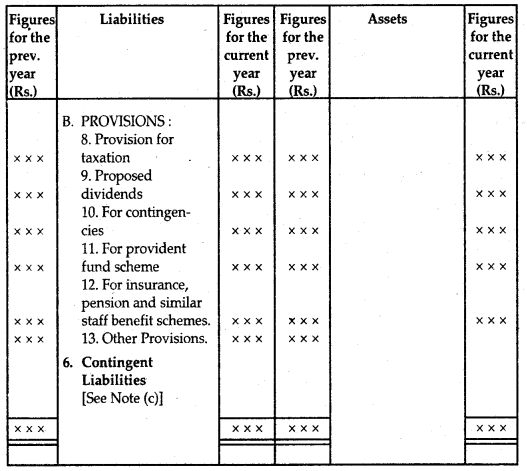
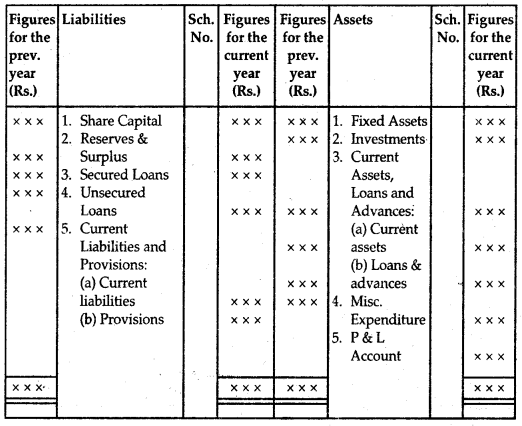
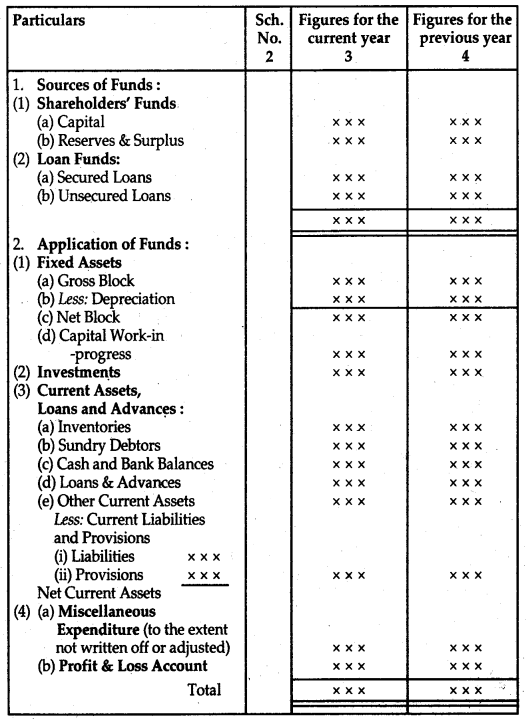
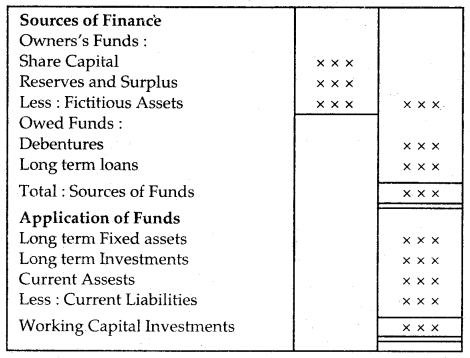
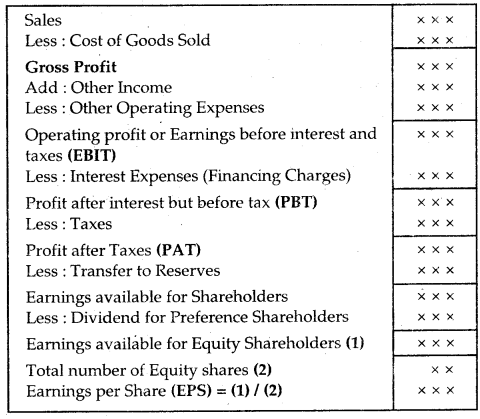
A Relook at the Financial Statements
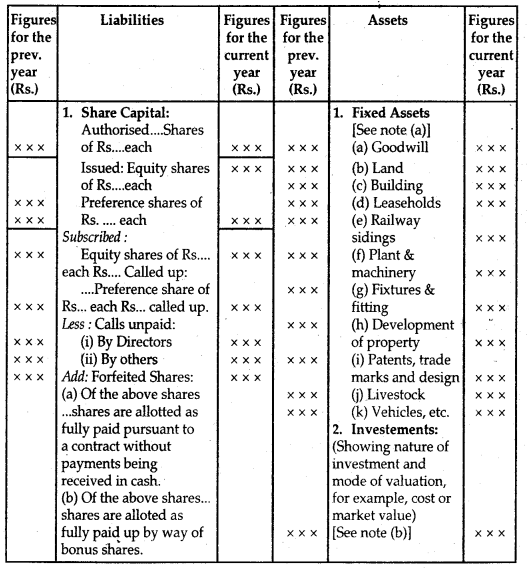
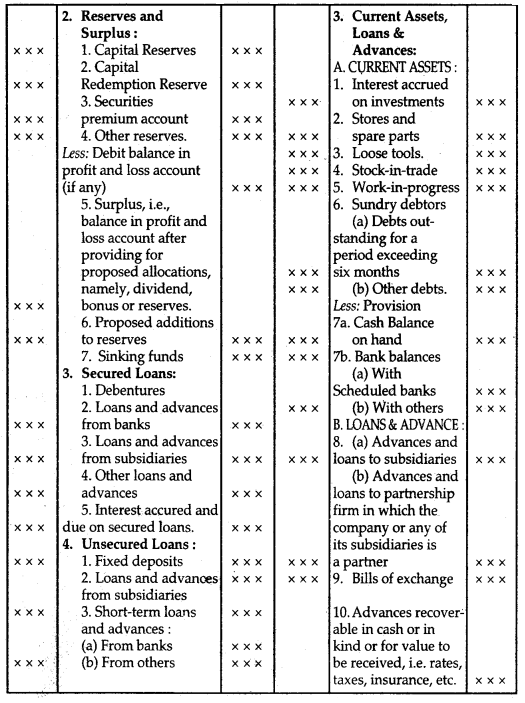
Position Statements
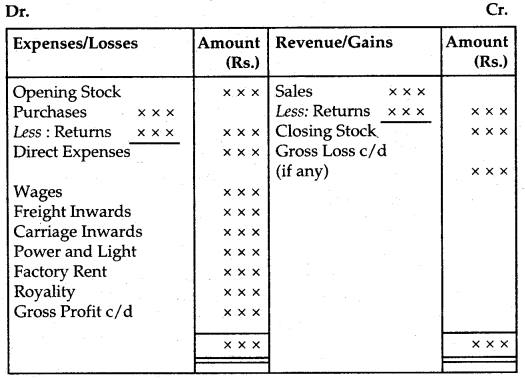
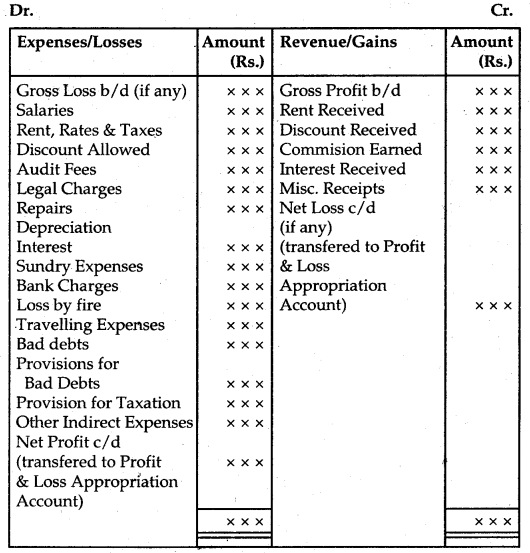
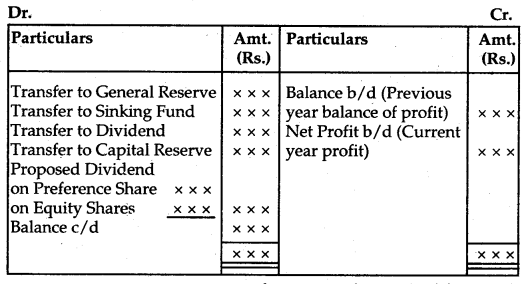
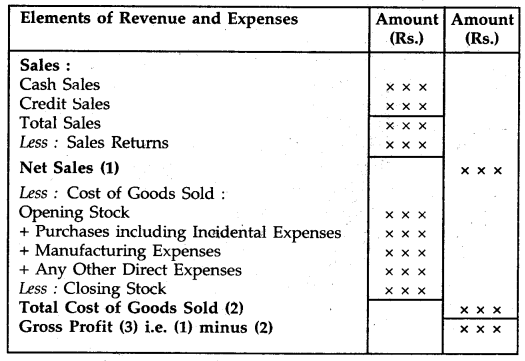
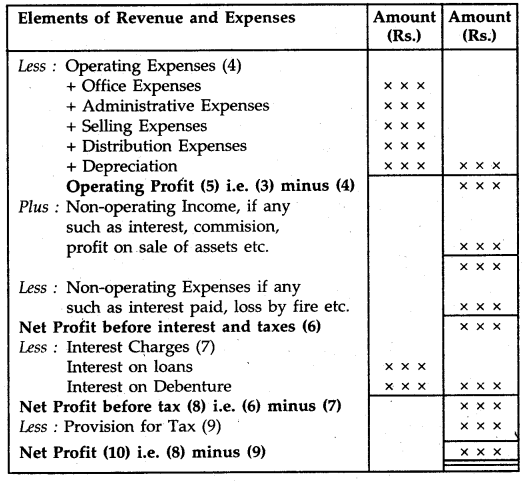
Income Statements
1. Liquidity Ratio
The liquidity ratios are used to determine the short-term solvency position of a business enterprise. The term liquidity means the conversion of the assets into cash without much loss. The objective is to find out the ability of the business enterprise to meet short-term liabilities.
The ratio included in this category is the Current Ratio and Liquid Ratio.
1. Current Ratio:
The current ratio is the proportion of current assets to current liabilities.
Current Ratio = \(\frac{\text { Current Assets }}{\text { Current Liabilities }}\)
Current Assets: which mean the assets which are held for their conversion into cash within a year. Tire following are the examples of Current Assets:
- Cash Balances.
- Marketable Securities
- Bank Balance Debtors
- Bills Receivable
- Stock
- Prepaid Expenses etc.
- Short term loans Accrued Income
Current Liabilities: which mean the liabilities which are expected to be matured within a year. The following are the examples of Current Liabilities:
- Creditors
- Provision for tax
- Bank overdraft
- Unclaimed dividend
- Bills Payable
- Income-received in
- Short Term Loans
- advance etc.
Significance: An ideal ratio is 2:1. A higher ratio indicates poor investment policies of management and poor inventory control while a low ratio indicates lack of liquidity and shortage of working capital. The current ratio, thus, throws good light on the short-term financial position and policy of a firm.
2. Liquid Ratio or Quick Ratio
It is the ratio of quick (or liquid) assets to current liabilities.
Quick Ratio = \(\frac{\text { Quick Assets }}{\text { Current Liabilities }}\)
Quick Assets (or Liquid Assets) = Current Assets – Stock – Prepaid Expenses.
Tire objective of computing this ratio is to measure the ability of the firm to meet its short-term obligation as and when due without relying upon the realization of stock. Significance: A quick ratio of 1: 1 is supposed to be good for the reason that it indicates the availability of funds to meet the liabilities 100%.
If this ratio is more than 1: 1 it can be said that the financial position of the business enterprise is sound and good. On the other hand, if the ratio is less than 1:1 i.e. liquid assets are less than current liabilities, the financial position of the concern shall be deemed to be unsound and additional cash will have to be provided for the payment of current liabilities.
2. Solvency Ratios
This ratio shows the long-term financial solvency and measures the enterprise’s ability to pay the interest regularly and to repay the principal on maturity or in pre-determined installments at due dates. The following ratios are normally computed for solvency analysis,
(a) Debt equity ratio;
(b) Total assets to debt ratio
(c) Proprietary ratio
(d) Interest Coverage ratio
(a) Debt Equity Ratio: The debt-equity ratio is worked out to ascertain the soundness of the long-term financial policies of the firm. This ratio establishes a relationship between long-term debt and shareholders’ funds.
Debt-Equity Ratio = \(\frac{\text { Long term Debts }}{\text { Shareholder’s Funds }}\)
Long term Debts = Debentures + Long Term Loans
Shareholder’s Funds = Preference Share Capital + Equity Share Capital + General Reserve + Capital Reserves + Securities Premium balances + Credit balances of Profit & Loss A/c – Preliminary Expenses (Fictitious Assets) – Share Issue Expenses- Discount on Issue of Share/Debenture – Underwriting Commission
Or
Shareholder’s Fund = Fixed Assets + Current Assets – Current Liabilities
Shareholder’s Fund is alternatively termed as internal funds and long-term debts are termed as external funds as well. Hence debt-equity ratio is computed as
Debt equity ratio = External Funds/Internal Funds
Significance: The debt-equity ratio of 2:1 is generally accepted as ideal. A low ratio is considered favorable from an external investor’s point of view as they get more security. On the other hand, a high debt-equity ratio indicates that the claims of the creditors are greater than those of the owners.
(b) Total Assets to Debt Ratio: This ratio shows the relationship between total assets and the long-term debts of the firms.
Total Assets to Debt Ratio = \(\frac{\text { Total Assets }}{\text { Long Term Debts }}\)
Total Assets = Fixed Assets + Current Assets – Fictitious Assets Significance: This ratio measures the proportion of total assets funded by long-term debt. Tire higher the ratio, the lesser role is played by loaned funds in financing the assets engaged in profit-generating activities of an organization and vice-versa.
(c) Proprietary Ratio: The objective of computing the Proprietary Ratio is to establish the relationship between proprietor’s funds and total assets.
Total Assets: Fixed Assets + Current Assets – Fictitious Assets.
Significance: Proprietary ratio attempts to indicate the part of total assets funded through equity. The higher the ratio, the more profitable it is for the creditors and the management will have to depend less on outside funds. If the ratio is low, the creditors can be suspicious about the repayment of their debt.
(d) Interest Coverage Ratio: The objective of this ratio is to measure the debt servicing capacity of a business firm in respect of fixed interest on the long-term debts. It also shows whether the firm has sufficient income to pay interest on maturity dates.
Interest Coverage Ratio = \(\frac{\text { Net Profit before Interest and Tax }}{\text { Interest on long term debts }}\)
Significance: It reveals the number of times interest is covered by the profits available for interest. A higher ratio ensures the safety of return on the amount of debt and it also ensures the availability of surplus for shareholders.
3. Turnover (or Activity) Ratios:
These ratios measure the effectiveness with which a firm uses its available resources. These ratios are called ‘Turnover Ratios’ since they indicate the speed with which the resources are being turned into sales. These ratios, thus express the relationship between the cost of goods sold or sales and various assets and are expressed in a number of times.
Tire following are the important ratios of this category:
- Stock Turnover Ratio
- Debtors Turnover Ratio
- Creditors Turnover Ratio
- Working Capital Turnover Ratio
- Fixed Assets Turnover Ratio
- Current Assets Turnover Ratio
1. Stock or Inventory Turnover Ratio: This ratio establishes a relationship between the cost of goods sold and average inventory. The objective of computing this ratio is to determine the efficiency in which the inventory is utilized.
Cost of Goods Sold
Stock Turnover Ratio = \(\frac{\text { Cost of Goods Sold }}{\text { Average Stock }}\)
Cost of Goods Sold = Sales – Gross Profit
OR = Opening Stock + Purchases + Direct Expenses – Closing Stock
Average Stock = \(\frac{\text { Opening Stock + Closing Stock }}{2}\)
If the figure of Average Stock cannot be ascertained due to the absence of the figure of opening stock, the figure of closing stock may be used as average stock.
Significance: This ratio shows the rate at which stocks are converted into sales. The higher the ratio, the better it is for the business, since it means that stock is being quickly converted into sales. Industries which has a very high stock turnover ratio may be operating with a low margin of profit and vice-versa.
2. Debtors Turnover Ratio or Receivable Turnover Ratio: This ratio is computed to establishes the relationship between net credit sales and average debtors (or receivables) of the year. It shows the rate at which cash is generated by the turnover of debtors.
Debtors Turnover Ratio = \(\frac{\text { Net Credit Sales }}{\text { Average Accounts Receivable }}\)
Average Accounts Receivable:
Net Credit Sales = Total Sales – Cash Sales Account Receivables = Debtors + Bills Receivable
Average Accounts Receivables = \(\frac{\text { Opening Debtors and } \mathrm{B} / \mathrm{R}+\text { Closing Debtors and } \mathrm{B} / \mathrm{R}}{2}\)
It is important to note that doubtful debts are not deducted from total debtors.
In case details regarding opening and closing receivables and credit sales are not given, the ratio may be worked out as follows:
Debtor’s Turnover Ratio = \(\frac{\text { TotalSales }}{\text { Accounts Receivable }}\)
Significance: This ratio indicates the number of times the receivable are turned over in a year in relation to sales. It shows, how quickly debtors are converted into cash. The higher the ratio, the better it is, since it means speedier collection and lesser amount being blocked up in debtors and vice versa.
3. Creditors Turnover Ratio or Payable Turnover Ratio:
Creditors Turnover Ratio indicates the pattern of payment of accounts payable. As accounts payable arise on account of credit purchases, it expresses the relationship between credit purchases and accounts payable.
Net Credit Purchases = Total Purchases – Cash Purchases Accounts Payable = Creditors + Bills Payable Average
Accounts Payable = \(\frac{\text { Opening Creditors and } \mathrm{B} / \mathrm{P}+\text { Closing Creditors and } \mathrm{B} / \mathrm{P}}{2}\)
In case details regarding opening creditors and closing creditors and credit purchases are not given, the ratio may be worked out as follows
Creditor’s Turnover Ratio = \(\frac{\text { TotalPurchases }}{\text { Accounts Payable }}\)
Significance: It shows the average payment period. By comparing it with the credit period allowed by the suppliers, the conclusion may be drawn. A lower ratio means the credit allowed by the supplier is not enjoyed by the business. A higher ratio means a delayed payment to the supplier which is not a very good policy as it may affect the reputation of the business.
Investment (Net Assets) Turnover Ratio:
Investment creates assets. These ratios study the velocity of utilization of long-term funds. It throws light on the rotation of capital employed in the business. Efficient utilization means better liquidity and ‘ profitability.
Net Sales
Investment Turnover Ratio = \(\frac{\text { Net Sales }}{\text { Capital Employed }}\)
Net Sales = Total Sales – Sales Return
Capital Employed= Fixed Assets + Working Capital
4. Working Capital Turnover Ratio: This ratio indicates
whether the working capital has been effectively utilized or not in making sales. In fact, in the short run, it is the current assets and current liabilities which play a major role. Careful handling of current assets and current liabilities will mean a reduction in the amount of capital employed thereby improving turnover.
Working Capital Turnover Ratio = \(\frac{\text { Net Sales }}{\text { Working Capital }}\)
Working Capital = Current Assets – Current Liabilities
Significance: A high working capital turnover ratio show the efficient utilization of working capital in generating sales. A low ratio, on the other hand, may indicate an excess of working capital or working capital has not been utilized efficiently.
5. Fixed Assets Turnover Ratio: This ratio established the relationship of Fixed assets with sales.
Fixed Assets Turnover Ratio = \(\frac{\text { Net Sales }}{\text { Net Fixed Assets }}\)
6. Current Assets Turnover Ratio: This ratio established the relationship of current assets with sales.
Current Assets Turnover Ratio = \(\frac{\text { Net Sales }}{\text { Net Current Assets }}\)
4. Profitability Ratios: As we know that the efficiency in business is measured by profitability. Thus, profitability ratios are computed to measures the efficiency of the business. Profit earning capacity may be expressed in the form of sales.
Some important Profitability Ratios are following:
- Gross Profit Ratio
- Operating Ratio
- Net Profit Ratio
- Return on Investment Ratio
- Earnings per Share Ratio
- Dividend per Share
- Book Value per Share
- Price Earning Ratio
1. Gross Profit Ratio: The main objective of computing this ratio is to determine the efficiency with which production and/or purchase operations are carried on. It establishes a relationship of gross profit on sales of a firm, which is calculated in percentage.
Gross Profit Ratio = \(\frac{\text { Gross Profit }}{\text { Net Sales }}\) × 100
Gross Profit = Net Sales – Cost of Goods Sold
Cost of Goods Sold = Opening Stock + Purchases + Direct Expenses – Closing Stock
Net Sales = Total Sales – Sales Return
Significance: It is a reliable guide to the adequacy of selling price and efficiency of trading activities. No ideal ratio is fixed but normally a higher ratio is always considered good so as to cover not only the remaining costs but also to allow proper returns to the owner.
2. Operating Ratio: This ratio establishes the relationship between the dying cost of goods sold plus other operating expenses to net sales. The lower percentage of operating ratio, the higher the net profit ratio.
Operating Ratio = \(\frac{\text { Cost of Goods Sold + Operating Expenses }}{\text { Net Sales }}\) × 100
OR
Operating Ratio = \(\frac{\text { Operating Cost }}{\text { Net Sales }}\) × 100
Operating Expenses = Office or Financial Expenses + Administrative
Expenses + Selling and Distribution Expenses + Discount + Bad Debts + Interest on Short-term Loans
Cost of Goods Sold = Sales – Gross Profit
Significance: The operating ratio is the yardstick to measure the efficiency with which a business is operated. It shows the percentage of net sales that is absorbed by the cost of goods sold and operating expenses. A high operating ratio is considered unfavorable because it leaves a smaller margin of profit to meet non-operating expenses but, a lower operating ratio is considered better.
3. Operating Profit Ratio: It is calculated to reveal operating margin. It may be computed directly or as a residual of the operating ratio.
Operating Profit Ratio = 100 – Operating Ratio
Alternatively,
Operating Profit Ratio = \(\frac{\text { Operating Profit }}{\text { Sales }}\) × 100
Operating Profit = Sales – Operating Cost
Significance: Operating profit ratio helps to analyze the performance of the business and throws light on the operational efficiency of the business. It is very useful for inter-firm as well as intra-firm comparison.
4. Net Profit Ratio: Net profit ratio is based on the all-inclusive concept of profit. It relates sales to net profit after operational as well as non-operational expenses and income.
Net Profit Ratio = \(\frac{\text { Net Profit }}{\text { Sales }}\) × 100
Net Profit is taken after income tax.
Significance: It is a measure of net profit margin in relation to sales. It expresses the overall efficiency of the business.
A high net profit ratio would enable the firm
- to pay higher dividends,
- to face bad economic conditions
- to create adequate general reserves. A low net profit ratio has opposite results.
Overall Profitability Ratios
The overall profitability ratio establishes the relationship of profits to the number of funds employed.
Overall Profitability Ratio = \(\frac{\text { Profit }}{\text { Investment of Funds }}\) × 100
(a) Investment refers to Equity Shareholder’s Fund: Profits are considered after preference dividend. The investment includes Equity Share Capital + Reserves and Surplus – Fictitious Assets.
(b) Investment refers to Shareholder’s Fund: Profit is considered before the dividend. The investment includes Equity Share Capital + Preference Share Capital + Reserves and Surplus – Fictitious Assets.
(c) Investment refers to Long-Term Fund Employed: Profit before tax and interest is compared with capital employed to calculate return on capital employed.
The investment includes Equity Share Capital + Preference Share Capital + Long Term Funds +Reseryes and Surplus – Fictitious Assets.
5. Return on Shareholder’s Fund: This ratio reflects the return on the shareholder’s fund that the business enterprise was able to earn.
Return on Shareholder’s Fund = \(\frac{\text { Profit after appropriation }(\text { except Preference dividend })}{(\text { Share Capital + Reserves \& Surplus) }}\) × 100
Significance: The proprietors or shareholders are primarily interested in the profit-earning capacity of the business in which their funds are invested. If the profits earned by the firm are insufficient, it will fail to attract funds for expanding operations since additional capital will not be available.
6. Return on Equity Shareholder’s Fund: It is computed to draw an idea about the return available to equity shareholders.
Return on Equity Capital = \(\frac{\text { Profit available for Equity Shareholder }}{\text { Equity Share Capital }}\)
Profit available for Equity Shareholder
7. Return on Capital Employed or Investment (ROCE or ROI): This ratio, also known as return on investment, is a basic ratio of profitability. It is calculated by establishing a relationship between the profit earned and the capital employed to earn the profits. It is therefore an indicator of the earning capacity of the capital invested in the business.
Return on Capital Employed or Return on Investment = \(\frac{\text { Profit before Interest and Tax }}{\text { Capital Employed }}\) × 100
Capital Employed = Fixed Assets + Working capital = Long Term Funds + Share Capital + Reserves & Surplus – Fictitious Assets (Miscellaneous Expenditure)
Significance: It measures the return on funds employed by the business. It reveals the efficiency of the business in the utilization of funds invested to it by shareholders, debenture holders, and long-term liabilities. For inter-firm comparison, return on capital employed, which reveals overall utilization of funds and return on capital employed, is considered better measures of profitability as compared to return on shareholder funds.
8. Earnings Per Share
EPS = \(\frac{\text { Profit available for equity Shareholders }}{\text { No. of Equity Shares }}\)
9. Book Value Per Share = \(\frac{\text { Equity Shareholder’s Funds }}{\text { No. of Equity Shares }}\)
10. Dividend Per Share = \(\frac{\text { Total Equity Dividend }}{\text { No. of Equity Shares }}\)
11. Price Earning Ratio = \(\frac{\text { Market Price of a Share }}{\text { Earning per Share }}\)
Important Formulas
Liquidity Ratios:
1. Current Ratio = \(\frac{\text { Current Assets }}{\text { Current Liabilities }}\)
2. Quick Ratio
Quick Ratio = \(\frac{\text { Quick Assets }}{\text { Current Liabilities }}\)
Quick Assets = Current Assets – Stock – Prepaid Expenses
Solvency Ratio
1. Debt Equity Ratio = \(\frac{\text { Long Term Debts }}{\text { Shareholder’s Fund }}\)
Shareholder’s Fund = Pref. Share capital + Eq. Share cap. + Gen. Reserve + Cap. Res. + Securities Premium balance + Credit balance of P & L A/c – Preliminary Expenses (Fictitious Assets) – Share Issue Expenses – Discount on issue of Share/Debenture – Underwriting Commission
OR
= Fixed Assets + Current Assets – Current Liabilities
2. Total Assets to Debt Ratio
Total Assets to Debt Ratio = \(\frac{\text { Total Assets }}{\text { Long Term Debts }}\)
Total Assets = Fixed Assets + Current Assets – Fictictious Assets
3. Proprietary Ratio
Proprietory Ratio = \(\frac{\text { Shareholder’s Fund }}{\text { Total Assets }}\)
4. Interest Coverage Ratio Interest Coverage Ratio
Interest Coverage Ratio Interest Coverage Ratio = \(\frac{\text { Net Profit before Interest and Tax }}{\text { Interest on long term debts }}\)
Turnover Ratios
1. Stock Turnover Ratio
Stock Turnover Ratio = \(\frac{\text { Cost of Goods Sold }}{\text { Average Stock }}\)
Cost of Goods Sold = Sales – Gross Profit OR = Opening Stock + Purchases + Direct Expenses – Closing Stock
Opening Stock + Closing Stock
Average Stock = \(\frac{\text { Opening Stock + Closing Stock }}{2}\)
2. Debtors Turnover Ratio
Debtors Turnover Ratio = \(\frac{\text { Net Credit Sales }}{\text { Average Account Receivables }}\)
Average A/c Receivable = \(\frac{\text { Opening Debtor and } \mathrm{B} / \mathrm{R}+\text { Closing Debtor and } \mathrm{B} / \mathrm{R}}{2}\)
3. Creditor Turnover Ratio
Creditor Turnover Ratio = \(\frac{\text { Net Credit Purchases }}{\text { Average Account Payable }}\)
Average Account Payable
Average A/c Payable = \(\frac{\text { Opening Creditors and } \mathrm{B} / \mathrm{P}+\text { Closing Creditors and } \mathrm{B} / \mathrm{P}}{2}\)
4. Investment Turnover Ratio
Investment Turnover Ratio = \(\frac{\text { Net Sales }}{\text { Capital Employed }}\)
Capital Employed = Fixed Assets + Working Capital
5. Working Capital Turnover Ratio
Working Capital Turnover Ratio = \(\frac{\text { Net Sales }}{\text { Working Capital }}\)
Working Capital = Current Assets – Current Liabilities
6. Fixed Assets Turnover Ratio
Fixed Assets Turnover Ratio = \(\frac{\text { Net Sales }}{\text { Net Fixed Assets }}\)
7. Current Assets Turnover Ratio
Current Assets Turnover Ratio = \(\frac{\text { Net Sales }}{\text { Net Current Assets }}\)
Profitability Ratio
1. Gross Profit Ratio
Gross Profit Ratio = \(\frac{\text { Gross Profit }}{\text { Net Sales }}\) × 100
Gross Profit = Net Sales – Cost of Goods Sold
2. Operating Ratio
Operating Ratio = \(\frac{\text { Cost of Goods Sold + Operating Expenses }}{\text { Net Sales }}\) × 100
Or
= \(\frac{\text { Operating Cost }}{\text { Net Sales }}\) × 100
Operating Expenses = Office and Financial Expenses + Administrative Expenses+Selling and Distribution Expenses + Discount + Bad debts + Interest on Short Term Loans.
3. Operating Profit Ratio
Operating Profit Ratio = 100 – Operating Ratio
OR Operating Profit Ratio= \(\frac{\text { Operating Profit }}{\text { Sales }}\)× 100
Operating Profit = Sales – Operating Cost 4. Net Profit Ratio
4. Net Profit Ratio
Net Profit Ratio = \(\frac{\text { Net Profit }}{\text { Sales }}\) × 100
5. Overall Profitability Ratios
Overall Profitablility Ratio = \(\frac{\text { Profit }}{\text { Investment of Funds }}\) × 100
6. Return on Shareholders Fund
Return on Shareholders Fund = \(\frac{\text { Profit after appropriation (except Preference dividend) }}{(\text { Share Capital + Reserve and Surplus) }}\) × 100
7. Return on Equity Shareholders Fund
Return on Equity Capital = \(\frac{\text { Profit available for Equity Shareholder }}{\text { Equity Share Capital }}\) × 100
8. Return on Capital Employed or Investment (ROCE or ROI)
Return on Capital Employed Or Return on Investment = \(\frac{\text { Profit before Investment and Tax }}{\text { Capital Employed }}\) × 100
Capital Employed = Fixed Assets + Working Capital
= Long terms Funds + Share Capital + Reserve and Surplus – Fictitious Assets (Miscellaneous Expenditure)
9. Earnings Per Share (EPS)
EPS = \(\frac{\text { Profit available for Equity Shareholders }}{\text { No. of Equity Shares }}\)
10. Book Value Per Share
Book Value Per Share = \(\frac{\text { Equity Shareholders’s Funds }}{\text { No. of Equity Shares }}\)
11. Dividend Per Share
Dividend Per Share = \(\frac{\text { Total Equity Dividend }}{\text { No. of Equity Shares }}\)
12. Price Earning Ratio
Price Earning tio = \(\frac{\text { Market Price of a Share }}{\text { Earning Per Share }}\)