Number Systems Class 9 Notes Maths Chapter 1

Number Systems Class 9 Notes

On this page, you will find Number Systems Class 9 Notes Maths Chapter 1 Pdf free download. CBSE NCERT Class 9 Maths Notes Chapter 1 Number Systems will seemingly help them to revise the important concepts in less time.

CBSE Class 9 Maths Chapter 1 Notes Number Systems

Number Systems Class 9 Notes Understanding the Lesson

1. Number: A number is a mathematical object which is used in counting and measuring.

2. Number system: A number system defines a set of values used to represent a quantity.

3. Natural numbers: A set of counting numbers is called the natural numbers.
N = {1,2, 3, 4, 5,…}
These are infinite in number. Here first natural number is 1 whereas there is no last natural number.

4. Whole numbers: A set of natural numbers including zero is called the whole numbers.
W = {0, 1, 2, 3, 4, 5,…}

Note: All natural numbers are whole numbers but all whole numbers are not natural numbers.
Integers: A set of all whole numbers including negative of all the natural numbers.
Z = {…, – 7, – 6, – 5, – 4, – 3, – 2, – 1, 0, 1, 2, 3, 4, 5, 6, 7, …}

5. Rational Numbers
A number is called rational number if it can be expressed in the form of \(\frac{p}{q}\), where p and q are integers and q≠ 0.
Example: \(\frac{1}{2}, \frac{2}{3}, \frac{3}{4}, \frac{7}{9}, \text { etc. }\)

Note:

  • Every fractional number and integer is a rational number because they can be expressed in the form\(\frac{p}{q}\)
  • Between two rational numbers, infinite number of rational numbers can be possible. A rational number between two rational numbers a and b can be found as \(\frac{1}{2}\)(a + b)by using mean method.
  • The sum, difference and product of the rational numbers is always a rational number.
  • The quotient of a division of one rational number by a non-zero rational number is a rational number.

6. Types of Rational Numbers
1. The natural numbers form a subset of the integers.
2. Natural numbers with zero are referred to as non-negative integers.
3. The natural numbers without zero are known as positive integers.
4. When negative of a positive integer is added to the corresponding positive integer then it produces 0.

  • Terminating decimal: It has a finite number of digits after the decimal point.
    \(\frac{3}{8}\)=0.375
  • Non-terminating recurring decimal or repeating decimal: It has a digit or group of digits after the decimal point that repeat endlessly.
    Number Systems Class 9 Notes Maths Chapter 1

7. Irrational Numbers
Those numbers which cannot be expressed in the form of \(\frac{p}{q}\), where p and q are integers and
q ≠0. They neither terminate nor do they repeat. They are also known as non-terminating non-repeating numbers. Example: \(\sqrt{2}, \sqrt{3}, \sqrt{5}, \sqrt{7}, \sqrt{13}, \sqrt{\frac{7}{3}}, \ldots 5+\sqrt{7}\) are irrational numbers.
An irrational number between two rational numbers a and b can be found as the square root of their product \(\sqrt{a b}\)

Note:

  • Euler’s number ‘e’ is an irrational whose first few digits are 2.71828….
  • The sum, difference, multiplication and division of irrational numbers are not always irrational.
  • Rational number and irrational number can be represented on a number line.
  • Irrational numbers like \(\sqrt{2}, \sqrt{3}, \sqrt{5}\) etc. can be represented on a number line by using Pythagoras theorem.

8. Number line: A number line is a line which represent all the numbers. It is a picture of a straight line on which every point is assumed to correspond to a real number and every real number to a point.

Number Systems Class 9 Notes Maths Chapter 2

9. Real Numbers”
The union of the set of rational numbers and the set of irrational numbers.
A group of rational or irrational numbers is called real numbers. It can be represented on a number line.

10. Successive Magnification

  • Let us suppose we locate 4.46 on the number line. We know 4.46 lies between 4 and 5.
  • Now let us divide the portion between 4 and 5 into 10 equal parts and represent 4.1, 4.2, 4.3, …, 4.9.
  • We know that 4.46 lies between 4.4 and 4.5 so further divide the portion into 10 equal parts, then these points will represent 4.41, 4.42, 4.43, …, 4.49 on number line. Thus we can locate the given number 4.46 on the number line.

Number Systems Class 9 Notes Maths Chapter 4

Number Systems Class 9 Notes Maths Chapter 3

Class 9 Social Science Notes | NCERT Class 9 SST Notes

NCERT Class 9 social science Notes PDF free download provided gives you an overview of the respective chapter and prepared in a manner that every concept is covered as per the syllabus guidelines. NCERT Notes for Class 9 social science SST Geography, History and Civics Standard are very effective for students to have last minute quick revision. Download the required study material from the resources available here and score higher grades in your exams.

Social Science Class 9 Notes CBSE

History Class 9 Notes

Geography Class 9 Notes

Civics Class 9 Notes

Economics Class 9 Notes

We believe the information shared regarding the NCERT Notes for Class 9 social science & Study Material has aided in your preparation. If you need any further assistance do leave us a comment and we will get back to you at the earliest possible. Stay tuned to our site for more information on Class 9th SST social science Notes, Study Materials, and other preparation related stuff.

NCERT Class 9 Maths Notes

NCERT Class 9 Maths Notes Pdf free download provided gives you an overview of the respective chapter and prepared in a manner that every concept is covered as per the syllabus guidelines. NCERT Notes for Class 9 Maths Standard are very effective for students to have last minute quick revision. Download the required study material from the resources available here and score higher grades in your exams.

CBSE Class 9 Maths Notes

  1. Number Systems Class 9 Notes
  2. Polynomials Class 9 Notes
  3. Introduction to Euclid’s Geometry Class 9 Notes
  4. Lines and Angles Class 9 Notes
  5. Triangles Class 9 Notes
  6. Coordinate Geometry Class 9 Notes
  7. Heron’s Formula Class 9 Notes
  8. Linear Equations in Two Variables Class 9 Notes
  9. Quadrilaterals Class 9 Notes
  10. Areas of Parallelograms and Triangles Class 9 Notes
  11. Circles Class 9 Notes
  12. Constructions Class 9 Notes
  13. Surface Areas and Volumes Class 9 Notes
  14. Statistics Class 9 Notes
  15. Probability Class 9 Notes

We believe the information shared regarding the NCERT Notes for Class 9 Maths & Study Material has aided in your preparation. If you need any further assistance do leave us a comment and we will get back to you at the earliest possible. Stay tuned to our site for more information on Class 9th Maths Notes, Study Materials, and other preparation related stuff.

Probability Class 9 Extra Questions Maths Chapter 15 with Solutions Answers

Here we are providing Probability Class 9 Extra Questions Maths Chapter 15 with Answers Solutions, Extra Questions for Class 9 Maths was designed by subject expert teachers.

Extra Questions for Class 9 Maths Probability with Answers Solutions

Extra Questions for Class 9 Maths Chapter 15 Probability with Solutions Answers

Probability Class 9 Extra Questions Very Short Answer Type

Question 1.
The blood groups of some students of Class IX were surveyed and recorded as below :
Probability Class 9 Extra Questions Maths Chapter 15 with Solutions Answers 1
If a student is chosen at random, find the probability that he/she has blood group A or AB.
Solution:
Here,
total number of students = 19 + 6 + 13 + 12 = 50
Number of students has blood group A or AB = 19 + 13 = 32
Required probability = \(\frac{38}{50}\) = \(\frac{16}{25}\)

Question 2.
A group of 80 students of Class X are selected and asked for their choice of subject to be
taken in Class XI, which is recorded as below :
Probability Class 9 Extra Questions Maths Chapter 15 with Solutions Answers 2
If a student is chosen at random, find the probability that he/she is a student of either commerce or humanities stream.
Solution:
Here, total number of students = 80
Total number of students of Commerce or Humanities stream = 33
Required probability = \(\frac{33}{80}\)

Question 3.
A box contains 50 bolts and 150 nuts. On checking the box, it was found that half of the bolts and half of the nuts are rusted. If one item is chosen at random, find the probability that it is rusted.
Solution:
Total number of nuts and bolts in the box = 150 + 50
= 200
Number of nuts and bolts rusted = \(\frac{1}{2}\) × 200 = 100
P(a rusted nut or bolt) = \(\frac{100}{200}\) = \(\frac{1}{2}\)

Question 4.
A dice is rolled number of times and its outcomes are recorded as below:
Probability Class 9 Extra Questions Maths Chapter 15 with Solutions Answers 3
Find the probability of getting an odd number.
Solution:
Total number of outcomes = 250
Total number of outcomes of getting odd numbers = 35 + 50 + 53 = 138
∴ P(getting an odd number) = \(\frac{138}{250}\) = \(\frac{69}{125}\)

Question 5.
The probability of guessing the correct answer to a certain question is \(\frac{x}{2}\) If probability of
not guessing the correct answer is \(\frac{2}{3}\), then find x.
Solution:
Here, probability of guessing the correct answer = \(\frac{x}{2}\)
And probability of not guessing the correct answer = \(\frac{x}{2}\)
Now, \(\frac{x}{2}\) + \(\frac{2}{3}\) = 1
⇒ 3x + 4 = 6
⇒ 3x = 2
⇒ x = \(\frac{2}{3}\)

Question 6.
A bag contains x white, y red and z blue balls. A ball is drawn at the random, then what is the probability of drawing a blue ball.
Solution:
Number of blue balls = Z
Total balls = x + y + Z
∴ P(a blue ball) = \(\frac{z}{x+y+z}\)

Probability Class 9 Extra Questions Short Answer Type 1

Question 1.
750 families with 3 children were selected randomly and the following data recorded:
Probability Class 9 Extra Questions Maths Chapter 15 with Solutions Answers 4
If a family member is chosen at random, compute the probability that it has :
(i) no boy child
(ii) no girl child
Solution:
(i) P(no boy child) = \(\frac{100}{750}\) = \(\frac{2}{15}\)
and P (no girl child) = \(\frac{120}{750}\) = \(\frac{4}{25}\)

Question 2.
If the probability of winning a race of an athlete is \(\frac{1}{6}\) less than the twice the probability of losing the race. Find the probability of winning the race.
Solution:
Let probability of winning the race be p
∴ Probability of losing the race = 1 – p
According to the statement of question, we have
p = 2 (1 – p) – \(\frac{1}{6}\)
⇒ 6p = 12 – 12p – 1
⇒ 18p = 11
⇒ p = \(\frac{11}{18}\) .
Hence, probability of winning the race is \(\frac{11}{18}\).

Question 3.
Three coins are tossed simultaneously 150 times with the following frequencies of different outcomes :
Probability Class 9 Extra Questions Maths Chapter 15 with Solutions Answers 5
Compute the probability of getting :
(i) At least 2 tails
(ii) Exactly one tail
Solution:
Here, total number of chances = 150
(i) Total number of chances having at least 2 tails = 32 + 63 = 95
∴ Required probability = \(\frac{95}{150}\) = \(\frac{19}{30}\)
(ii) Total number of chances having exactly one tail = 30
∴ Required probability = \(\frac{30}{150}\) = \(\frac{1}{5}\)

Probability Class 9 Extra Questions Short Answer Type 2

Question 1.
The table shows the marks obtained by a student in unit tests out of 50 :
Probability Class 9 Extra Questions Maths Chapter 15 with Solutions Answers 6
Find the probability that the student get 70% or more in the next unit test. Also, the probability that student get less than 70%.
Solution:
Here, the marks are out of 50, so we first find its percentage (i.e., out of 100)
Probability Class 9 Extra Questions Maths Chapter 15 with Solutions Answers 7
Total number of outcomes = 5
Probability of getting 70% or more marks = \(\frac{3}{5}\)
Probability of getting less than 70% = \(\frac{2}{5}\)

Question 2.
Books are packed in piles each containing 20 books. Thirty five piles were examined for defective books and the results are given in the following table :
Probability Class 9 Extra Questions Maths Chapter 15 with Solutions Answers 8
One pile was selected at random. What is the probability that it has :
(i) no defective books ?
(ii) more than 0 but less than 4 defective books ?
(iii) more than 4 defective books ?
Solution:
Total number of books = 700
(i) P(no defective books) = \(\frac{400}{700}\) = \(\frac{4}{7}\)
(ii) P(more than 0 but less than 4 defective books) = \(\frac{269}{700}\)
13 (iii) P(more than 4 defective books) = \(\frac{13}{700}\)

Probability Class 9 Extra Questions Short Answer Type 1 and 2

Question 1.
Two coins are tossed simultaneously for 360 times. The number of times ‘2 Tails’ appeared was three times ‘No Tail’ appeared and number of times ‘1 Tail’ appeared is double the number of times ‘No Tail’ appeared. Find the probability of getting ‘Two tails’.
Solution:
Total number of outcomes = 360
Let the number of times ‘No Tail’ appeared be x
Then, number of times 2 Tails’ appeared = 3x
Number of times ‘1 Tail’ appeared = 2x
Now, x + 2x + 3x = 360
⇒ 6x = 360
⇒ x = 60
P(of getting two tails) = \(\frac{3 \times 60}{360}\) = \(\frac{1}{2}\)

Question 2.
A die was rolled 100 times and the number of times, 6 came up was noted. If the experimental probability calculated from this information is \(\frac{2}{5}\), then how many times 6 came up ? Justify your answer.
Solution:
Here, total number of trials = 100
Let x be the number of times occuring 6.
We know, probability of an event
= \(\frac { Frequency\quad of\quad the\quad event\quad occuring }{ Total\quad number\quad of\quad trails }\)
⇒ \(\frac{x}{100}\) = \(\frac{2}{5}\) [∵ Probability is given)
⇒ x = 40

Probability Class 9 Extra Questions Long Answer Type

Question 1.
Three coins are tossed simultaneously 250 times. The distribution of various outcomes is listed below :
(i) Three tails : 30,
(ii) Two tails : 70,
(iii) One tail : 90,
(iv) No tail : 60
Find the respective probability of each event and check that the sum of all probabilities is 1.
Solution:
Here, the total number of chances = 250
Total number of three tails = 30
Probability Class 9 Extra Questions Maths Chapter 15 with Solutions Answers 9

Question 2.
A travel company has 100 drivers for driving buses to various tourist destination. Given
below is a table showing the resting time of the drivers after covering a certain distance (in km).
Probability Class 9 Extra Questions Maths Chapter 15 with Solutions Answers 10
What is the probability that the driver was chosen at random :
(a) takes a halt after covering 80 km?
(b) takes a halt after covering 115 km?
(c) takes a halt after covering 155 km?
(d) takes a halt after crossing 200 km?
Solution:
Total number of drivers = 100
(a) P (takes a halt after covering 80 km) = \(\frac{13}{100}\)
(b) P (takes a halt after covering 115 km) = \(\frac{60}{100}\) = \(\frac{3}{5}\)
(c) P (takes a halt after covering 155 km) = \(\frac{90}{100}\) = \(\frac{9}{10}\)
(d) P (takes a halt after crossing 200 km) = \(\frac{10}{100}\) = \(\frac{1}{10}\)

Question 3.
A company selected 2300 families at random and surveyed them to determine a relationship between income level and the number of vehicles in a home. The information gathered is listed in the table below :
Probability Class 9 Extra Questions Maths Chapter 15 with Solutions Answers 11
If a family is chosen at random, find the probability that the family is :
(i) earning ₹7000 – ₹13000 per month and owning exactly 1 vehicle.
(ii) owning not more than one vehicle. (iii) earning more than ₹13000 and owning 2 or more than 2 vehicles. (iv) owning no vehicle
Solution:
Here, we have a total number of families = 2300
(i) Number of families earning ₹7000 to ₹13000 per month and owning exactly 1 vehicle = 295 + 525 = 820
Probability Class 9 Extra Questions Maths Chapter 15 with Solutions Answers 12

Question 4.
A survey of 2000 people of different age groups was conducted to find out their preference
in watching different types of movies :
Type I + Family Type II → Comedy and Family
Type III → Romantic, Comedy, and Family 242.
Type IV → Action, Romantic, Comedy and Family
Probability Class 9 Extra Questions Maths Chapter 15 with Solutions Answers 13
Find the probability that a person chosen at random is :
(a) in 18-29 years of age and likes type II movies
(b) above 50 years of age and likes all types of movies
(c) in 30-50 years and likes type I movies. :
Solution:
(a) Let E1 be the event, between the age group (18 – 29) years and liking type II movies
Favourable outcomes to event E1 = 160
∴ P(E1) = \(\frac{160}{2000}\) = \(\frac{160}{2000}\)
(b) Let E2 be the event, of age group above 50 years and like all types of movies
Favourable outcomes to event E2 = 9
∴ P(E2) = \(\frac{9}{2000}\)
(c) Let E3 be the event, between age group (30 – 50) years and liking type I movies
Favourable outcomes to event E3 = 505
∴ P(E3) = \(\frac{505}{2000}\) = \(\frac{101}{400}\)

Probability Class 9 Extra Questions HOTS

Question 1.
In a kitchen, there are 108 utensils, consisting of bowls, plates, and glasses. The ratio of bowls, plates the glasses is 4:2:3. A utensil is picked at random. Find the probability that :
(i) it is a plate.
(ii) it is not a bowl.
Solution:
Total utensils in the kitchen = 108
Let number of bowls be 4x, number of plates be 2x and number of glasses be 3x
∴ 4x + 2x + 3x = 108
9x = 108
x = \(\frac{108}{9}\) = 12
Thus, number of bowls = 4 × 12 = 48
Number of plates = 2 × 12 = 24
Number of glasses = 3 × 12 =
(i)P (a plate) = \(\frac{24}{108}\) = \(\frac{2}{9}\)
(ii) P (not a bowl) = \(\frac{24+36}{108}\) = \(\frac{60}{108}\) = \(\frac{5}{9}\)

Question 2.
A bag contains 20 balls out of which x are white.
(a) If one ball is drawn at random, find the probability that it is white.
(b) If 10 more white balls are put in the bag, the probability of drawing a white ball will be double that in part (a), find x.
Solution:
Here, total no. of balls = 20
No. of white balls = x
∴ P(white ball) = \(\frac{x}{20}\)
Now, 10 more white balls are added
∴ Total no. of balls = 20 + 10 = 30
Total no. of white balls = x + 10
According to statement of question, we have
\(\frac{x+10}{30}\) = 2 × \(\frac{x}{20}\)
⇒ \(\frac{x+10}{3}\) = x
⇒ x + 10 = 3x
⇒ 2x = 10
⇒ x = 5

Question 3.
Here is an extract from a mortality table.
Probability Class 9 Extra Questions Maths Chapter 15 with Solutions Answers 14
(i) Based on this information, what is the probability of a person aged 60′ of dying within a year ?
(ii) What is the probability that a person aged 61′ will live for 4 years ?
Solution:
(i) Clearly 16090 persons aged 60, (16090 – 11490), i.e., 4600 died before reaching their 61st birthday.
Therefore, P (a person aged 60 die within a year) = \(\frac{4600}{16090}\) = \(\frac{460}{1609}\)
(ii) Number of persons aged 61 years = 11490
Number of persons surviving for 4 years = 2320
P (a person aged 61 will live for 4 years) = \(\frac{2320}{11490}\) = \(\frac{232}{1149}\)

Probability Class 9 Extra Questions Value Based (VBQs)

Question 1.
An insurance company selected 2000 drivers at random (i.e., without any preference of one driver over another) in a particular city to find a relationship between age and accidents. The data obtained are given in the following table :
Probability Class 9 Extra Questions Maths Chapter 15 with Solutions Answers 15
Find the probability of the following events for a driver-selected at random from the city :
(i) being 18 – 29 years of age and having exactly 3 accidents in one year.
(ii) being 30 – 50 years of age and having one or more accidents in a year.
(iii) having no accident in one year.
(iv) Which value would you like to remember from this data?
Solution:
Here, total number of drivers = 2000
(i) The number of drivers in the age group 18 – 29 having exactly 3 accidents = 70
So, P (driver in age group 18 – 29 having exactly 3 accidents in one year) = \(\frac{70}{2000}\) = 0.035
(ii). The number of drivers in the age group 30 – 50 and having one or more than one accidents in one year = 118 + 65 + 20 + 21 = 224
P (driver in age group 30 – 50 having one or more accidents in one year) = \(\frac{224}{2000}\) = 0.112
(iii) The number of drivers having no accident in one year = 395 + 520 + 390 = 1305
So, P (driver having no accident) = \(\frac{1305}{2000}\) = 0.6525
(iv) Most people in India died or injured due to accidents as compared to any other country. So, we should obey the traffic rules as life is very precious.

Question 2.
100 plants were sown in six different colonies A, B, C, D, E, and F. After 31 days, the number of plants survived as follows :
Probability Class 9 Extra Questions Maths Chapter 15 with Solutions Answers 16
What is the probability of :
(i) more than 80 plants survived in a colony?
(ii) less than 82 plants survived in a colony?
(iii) which values are depicted from the above data?
Solution:
Here, we have total number of colonies = 6
(i) Number of colonies in which more than 80 plants survived = 4 (i.e., B, C, E and F)
∴ P(more than 80 plants survived in a colony) = \(\frac{4}{6}\) = \(\frac{2}{3}\)
(ii) Number of colonies in which less than 82 plants survived = 2 (i.e., A and D)
∴ P (less than 82 plants survived in a colony) = \(\frac{2}{6}\) = \(\frac{1}{3}\)
(iii) In order to keep environment safe, clean and green, we should grow more and more plants.

Statistics Class 9 Extra Questions Maths Chapter 14 with Solutions Answers

Here we are providing Statistics Class 9 Extra Questions Maths Chapter 14 with Answers Solutions, Extra Questions for Class 9 Maths was designed by subject expert teachers.

Extra Questions for Class 9 Maths Statistics with Answers Solutions

Extra Questions for Class 9 Maths Chapter 14 Statistics with Solutions Answers

Statistics Class 9 Extra Questions Very Short Answer Type

Question 1.
The points scored by a basketball team in a series of matches are follows:
17, 7, 10, 25, 5, 10, 18, 10 and 24. Find the range.
Solution:
Here, maximum points = 25 and
minimum points = 5
Range = Maximum value – Minimum value
= 25 – 5 = 20

Question 2.
The points scored by a basketball team in a series of matches are as follows:
17, 2, 7, 27, 25, 5, 14, 18, 10. Find the median.
Solution:
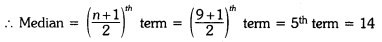
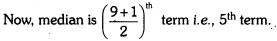
Here, points scored in ascending order are 2, 5, 7, 10, 14, 17, 18, 25, 27, we have n = 9 terms
Statistics Class 9 Extra Questions Maths Chapter 14 with Solutions Answers 1

Question 3.
The scores of an English test (out of 100) of 20 students are given below :
75, 69, 88, 55, 95, 88, 73, 64, 75, 98, 88, 95, 90, 95, 88, 44, 59, 67, 88, 99. .:: Find the median and mode of the data.
Solution:
The scores of an English test (out of 100) in ascending order are
44, 55, 59, 64, 67, 69, 73, 75, 75, 88, 88, 88, 88, 88, 90, 95, 95, 95, 98, 99
Here, n = 20
Statistics Class 9 Extra Questions Maths Chapter 14 with Solutions Answers 2
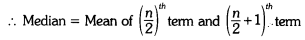
= Mean of 10th and 11th term Median
= Mean of 88 and 88 = 88
Mode = 88 [∵ 88 occured max. no. of times i.e., 5 times]

Question 4.
Mean of 20 observations is 17. If in the observations, observation 40 is replaced by 12, find the new mean.
Solution:
Since mean of 20 observations is 17
∴ Sum of the 20 observations = 17 × 20 = 340
New sum of 20 observations = 340 – 40 + 12 = 312
New mean = \(\frac{312}{20}\) = 15.6

Question 5.
Mean of 36 observations is 12. One observation 47 was misread as 74. Find the correct
mean.
Solution:
Mean of 36 observations = 12
Total of 36 observations = 36 × 12 = 432
Correct sum of 36 observations = 432 – 74 + 47 = 405
Correct mean of 36 observations = \(\frac{405}{36}\) = 11.25

Question 6.
The median of the data 26, 56, 32, 33, 60, 17, 34, 29, 45 is 33. If 26 is replaced by 62, then
find the new median.
Solution:
Here, the given data in ascending order is 17, 29, 32, 33, 34, 45, 56, 60, 62
Statistics Class 9 Extra Questions Maths Chapter 14 with Solutions Answers 3
Hence, new median is 34.

Question 7.
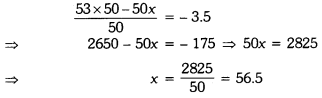
There are 50 numbers. Each number is subtracted from 53 and the mean of the numbers so obtained is found to be – 3.5. Find the mean of the given numbers.
Solution:
Let x be the mean of 50 numbers.
i. Sum of 50 numbers = 50x
Since each number is subtracted from 53.
According to question, we have
Statistics Class 9 Extra Questions Maths Chapter 14 with Solutions Answers 4

Question 8.
To draw a histogram to represent the following frequency distribution :
Statistics Class 9 Extra Questions Maths Chapter 14 with Solutions Answers 5
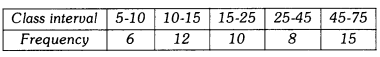
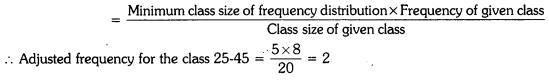
Find the adjusted frequency for the class 25-45.
Solution:
Adjusted frequency of a class
Statistics Class 9 Extra Questions Maths Chapter 14 with Solutions Answers 6

Statistics Class 9 Extra Questions Short Answer Type 1

Question 1.
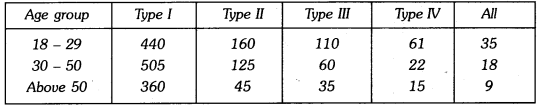
For a particular year, following is the distribution of ages (in years) of primary school teachers in a district :
Statistics Class 9 Extra Questions Maths Chapter 14 with Solutions Answers 7
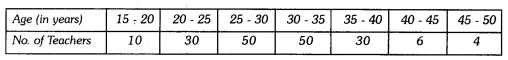
(i) Write the lower limit of first class interval.
(ii) Determine the class limits of the fourth class interval.
(iii) Find the class mark of the class 45 – 50.
(iv) Determine the class size.
Solution:
(i) First class interval is 15 – 20 and its lower limit is 15.
(ii) Fourth class interval is 30 – 35
Lower limit is 30 and upper limit is 35.
(iii) Class mark of the class 45 – 50 = \(\frac{45+50}{2}\) = \(\frac{95}{2}\) = 47.5
(iv) Class size = Upper limit of each class interval – Lower limit of each class interval
∴ Here, class size = 20 – 15 = 5

Question 2.
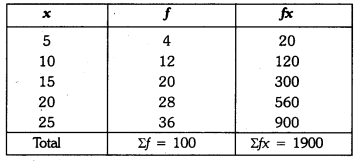
Find the mean of the following distribution :
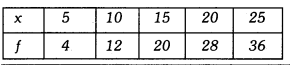
Statistics Class 9 Extra Questions Maths Chapter 14 with Solutions Answers 8
Solution:
Statistics Class 9 Extra Questions Maths Chapter 14 with Solutions Answers 9
Statistics Class 9 Extra Questions Maths Chapter 14 with Solutions Answers 10

Question 3.
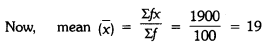
In figure, there is a histogram depicting daily wages of workers in a factory. Construct the frequency distribution table.
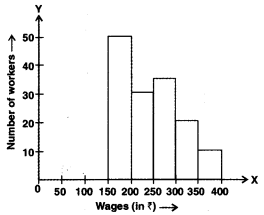
Statistics Class 9 Extra Questions Maths Chapter 14 with Solutions Answers 11
Solution:
Statistics Class 9 Extra Questions Maths Chapter 14 with Solutions Answers 12

Question 4.
Ten observations 6, 14, 15, 17, x + 1, 2x – 13, 30, 32, 34, 43 are written in ascending
order. The median of the data is 24. Find the value of x.
Solution:
Here, the arranged data is 6, 14, 15, 17, x + 1, 2x – 13, 30, 32, 34, 43
Total number of observations = 10
Statistics Class 9 Extra Questions Maths Chapter 14 with Solutions Answers 13
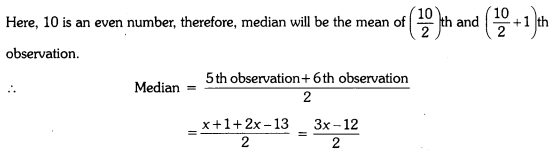
But median of data is 24 (given)
⇒ \(\frac{3 x-12}{2}\) = 24
⇒ 3x – 12 = 48
⇒ 3x = 60
⇒ x = 20
∴ The value of x = 20

Statistics Class 9 Extra Questions Short Answer Type 2

Question 1.
Draw a histogram for the given data :
Statistics Class 9 Extra Questions Maths Chapter 14 with Solutions Answers 14
Solution:
Let us represent class-intervals along x-axis and corresponding frequencies along y-axis on
a suitable scale, the required histogram is as under :
Statistics Class 9 Extra Questions Maths Chapter 14 with Solutions Answers 15

Question 2.
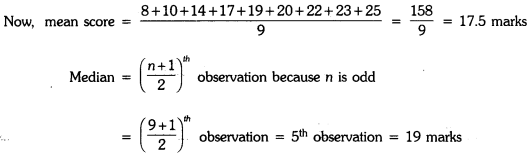
Given are the scores (out of 25) of 9 students in a Monday test :
14, 25, 17, 22, 20, 19, 10, 8 and 23
Find the mean score and median score of the data.
Solution:
Ascending order of scores is :
8, 10, 14, 17, 19, 20, 22, 23, 25
Statistics Class 9 Extra Questions Maths Chapter 14 with Solutions Answers 16

Question 3.
Draw a histogram of the weekly pocket expenses of 125 students of a school given below :
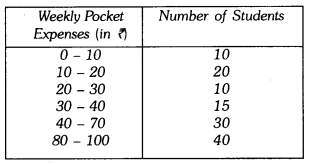
Statistics Class 9 Extra Questions Maths Chapter 14 with Solutions Answers 17
Solution:
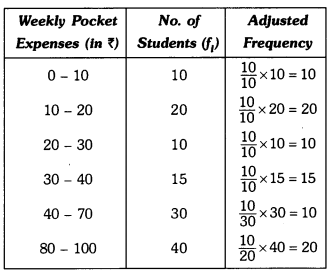
Here, the class sizes are different, so calculate the adjusted frequency for each class by using the formula.
Minimum class size Frequency density or adjusted frequency for a class
Statistics Class 9 Extra Questions Maths Chapter 14 with Solutions Answers 18
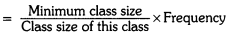
Here, the minimum class size = 10 – 0 = 10
Statistics Class 9 Extra Questions Maths Chapter 14 with Solutions Answers 19
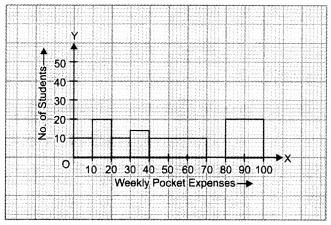
Let us represent weekly pocket money along x-axis and corresponding adjusted frequencies along y-axis on a suitable scale, the required histogram is as given below :
Statistics Class 9 Extra Questions Maths Chapter 14 with Solutions Answers 20

Question 4.
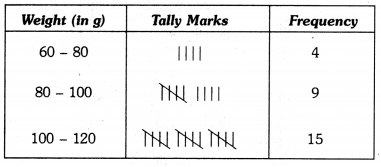
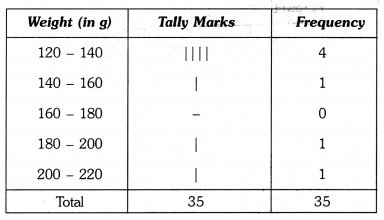
The weight in grams of 35 mangoes picked at random from a consignment are as follows:
131, 113, 82, 75, 204, 81, 84, 118, 104, 110, 80, 107, 111, 141, 136, 123, 90, 78, 90, 115, 110, 98, 106, 99, 107, 84, 76, 186, 82, 100, 109, 128, 115, 107, 115 From the grouped frequency table by dividing the variable range into interval of equal width of 20 grams, such that the mid-value of the first class interval is 70 g. Also, draw a histogram.
Solution:
It is given that the size of each class interval = 20 and the mid-value of the first class interval is 70.
Let the lower limit of the first class interval be a, then its upper limit = a + 20.
\(\frac{a+(a+20)}{2}\) = 70
⇒ a = 70 – 10 = 60
Thus, the first class interval is 60 – 80 and the other class-intervals are 80 – 100, 100 – 120, 120 – 140, 140 – 160, 160 – 180, 180 – 200 and 200 – 220.
So, the grouped frequency table is as under :
Statistics Class 9 Extra Questions Maths Chapter 14 with Solutions Answers 21
Statistics Class 9 Extra Questions Maths Chapter 14 with Solutions Answers 22
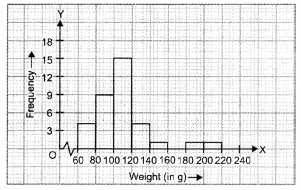
Let us represent weight (in g) along x-axis and corresponding frequencies along y-axis on a suitable scale, the required histogram is as under :
Statistics Class 9 Extra Questions Maths Chapter 14 with Solutions Answers 23

Statistics Class 9 Extra Questions Long Answer Type

Question 1.
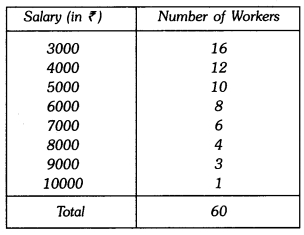
Find the mean salary of 60 workers of a factory from the following table :
Statistics Class 9 Extra Questions Maths Chapter 14 with Solutions Answers 24
Solution:
Statistics Class 9 Extra Questions Maths Chapter 14 with Solutions Answers 25
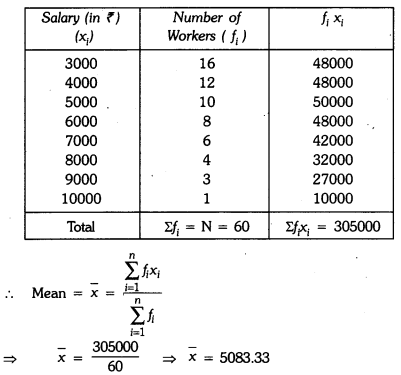
Hence, mean salary of 60 workers is ₹5083.33.
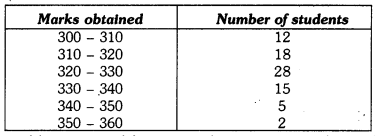
Question 2.
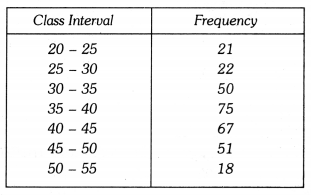
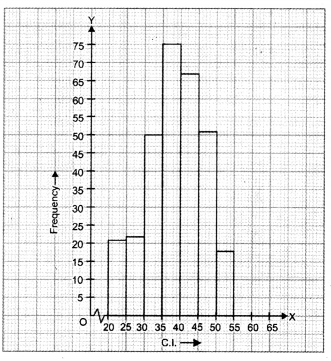
In a school marks obtained by 80 students are given in the table. Draw a histogram. Also,
make frequency polygon.
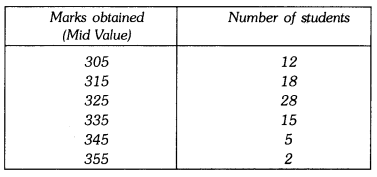
Statistics Class 9 Extra Questions Maths Chapter 14 with Solutions Answers 26
Solution:
∴ Lower limit of first class interval is 305 – \(\frac{10}{2}\) = 300
Upper limit of first class interval is 305 + \(\frac{10}{2}\) = 310
Thus, first class interval is 300 – 310
Statistics Class 9 Extra Questions Maths Chapter 14 with Solutions Answers 27
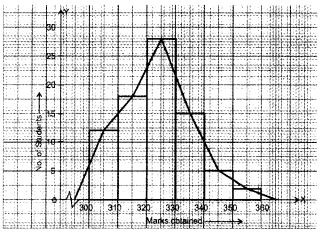
Required histogram and frequency polygon is given on the graph paper.
Statistics Class 9 Extra Questions Maths Chapter 14 with Solutions Answers 28

Question 3.
The following two tables gives the distribution of students of two sections according to the marks obtained by them :
Statistics Class 9 Extra Questions Maths Chapter 14 with Solutions Answers 29
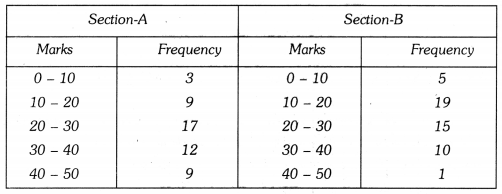
Represent the marks of the students of both the sections on the same graph by two frequency polygons. From the two polygons compare the performance of the two sections.
Solution:
The class marks are as under :
Statistics Class 9 Extra Questions Maths Chapter 14 with Solutions Answers 30
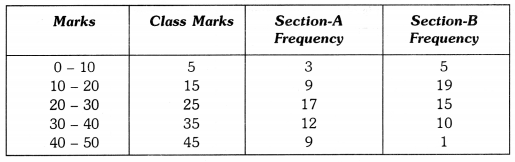
Let us take class marks on X-axis and frequencies on Y-axis. To plot frequency polygon of Section-A, we plot the points (5, 3), (15, 9), (25,17), (35,12), (45, 9) and join these points by (15,19). line segments. To plot frequency polygon of Section-B, we plot the points (5, 5), (15, 19), (25, 15), (35, 10), (45, 1) on the same scale and join these points by dotted line segments.
Statistics Class 9 Extra Questions Maths Chapter 14 with Solutions Answers 31
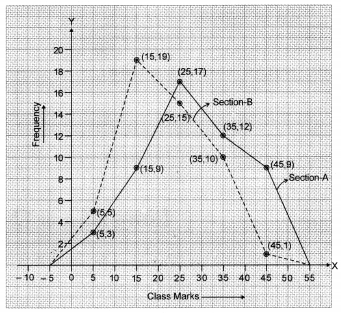
From the above two polygons, clearly the performance of Section A is better.

Statistics Class 9 Extra Questions HOTS

Question 1.
The mean weight of 60 students of a class is 52.75 kg. If mean weight of 25 students of this class is 51 kg, find the mean weight of remaining 35 students of the class.
Solution:
Total weight of 60 students = 60 × 52.75 kg = 3165 kg
Total weight of 25 students = 25 × 51 kg = 1275 kg
∴ Total weight of 35 students = (3165 – 1275) kg = 1890 kg
∴ Mean weight of 35 students = \(\frac{1890}{35}\) = 54 kg
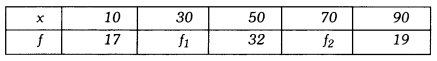
Question 2.
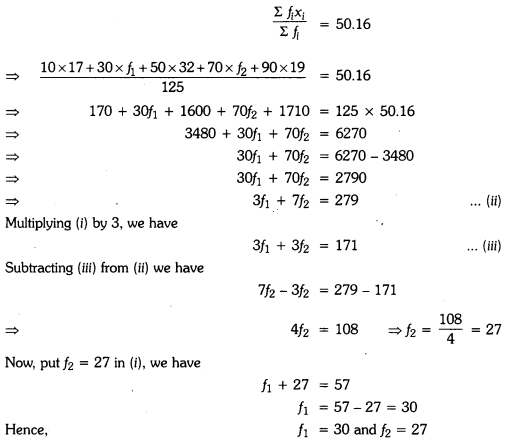
Find the missing frequencies in the following frequency distribution. If it is known that the mean of the distribution is 50.16 and the total number of items is 125.
Statistics Class 9 Extra Questions Maths Chapter 14 with Solutions Answers 32
Solution:
Since total number of items = 125
∴ 17 + f1 + 32 + f1 + 19 = 125
f1 + f2 = 125 – 17 – 32 – 19
f1 + f2 = 57 …..(i)
Now, mean of data = 50.16
We know that
Statistics Class 9 Extra Questions Maths Chapter 14 with Solutions Answers 33

Statistics Class 9 Extra Questions Value Based (VBQs)

Question 1.
The following data on the number of girls (to the nearest ten) per thousand boys in different sections of the Indian society is given below :
Statistics Class 9 Extra Questions Maths Chapter 14 with Solutions Answers 34
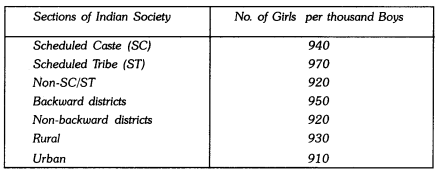
(i) Represent the information above by a bar graph.
(ii) In the classroom, discuss what conclusions can be arrived at from the graph.
(iii) What steps should be taken to improve the situation ?
Solution:
(i) The required graph is given below :
Statistics Class 9 Extra Questions Maths Chapter 14 with Solutions Answers 35
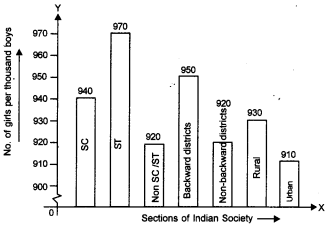
In the graph, different sections of the society is taken on X-axis and number of girls per thousand boys is taken on the Y-axis.
[Scale : 1 cm = 10 girls.]
(ii) From the graph, the number of girls to the nearest ten per thousand boys are maximum in scheduled tribes whereas they are minimum in urban.
(iii) Pre-natal sex determination should strictly banned in urban.

Question 2.
Shimpi, a class IX student received cash award of 10000 (Ten thousand) in the singing competition. Her father advised her to make a budget plan for spending this amount. She
made the following plan :
Statistics Class 9 Extra Questions Maths Chapter 14 with Solutions Answers 36
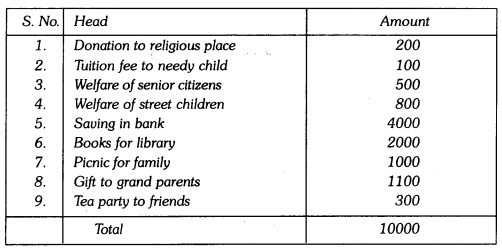
Make a bar graph for the above data.
From above answer the following questions :
(i) Which mathematical concepts have been covered in this ?
(ii) How will you rate her budget plan ? In your opinion which head has been given
(a) more than deserved and (b) less than it deserved ?
(iii) Which values are depicted in her plan?
Solution:
The bar graph of given data is given below :
Statistics Class 9 Extra Questions Maths Chapter 14 with Solutions Answers 37
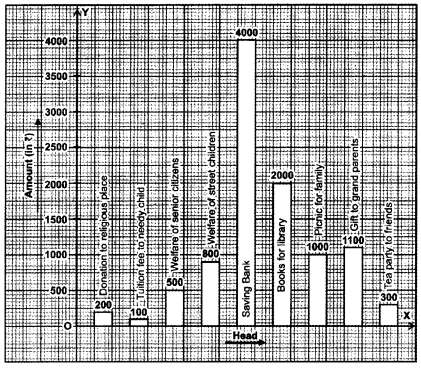
In the graph, head is taken on X-axis and amount is taken on Y-axis.
(i) Representation of data using bar graph.
(ii) Very good
(a) Picnic for family
(b) Tuition fee for needy child
(iii) Help the needy people and respect the elders.