ML Aggarwal Class 6 Solutions Chapter 15 Data Handling Objective Type Questions for ICSE Understanding Mathematics acts as the best resource during your learning and helps you score well in your exams.
ML Aggarwal Class 6 Solutions for ICSE Maths Chapter 15 Data Handling Objective Type Questions
Mental Maths
Question 1.
Fill in the blanks:
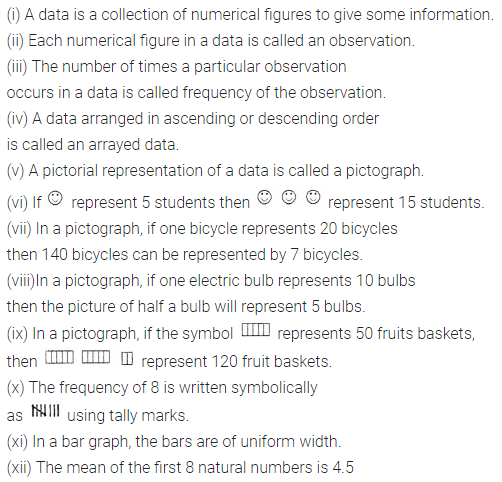
(i) A ……. is a collection of numerical figures to give some information.
(ii) Each numerical figure in data is called an ………..
(iii) The number of times a particular observation occurs in a data is called … of the observation.
(iv) A data arranged in ascending or descending order is called an ………… data.
(v) A pictorial representation of a data is called a …………
(vi) If  represent 5 students then
  represent ………… students.
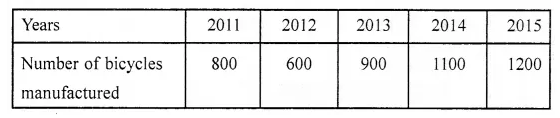
(vii) In a pictograph, if one bicycle represents 20 bicycles then 140 bicycles can be represented by ………… bicycles.
(viii)In a pictograph, if one electric bulb represents 10 bulbs then the picture of half a bulb will represent ………… bulbs.
(ix) In a pictograph, if the symbol  represents 50 fruits baskets, then
 represent ………… fruit baskets.
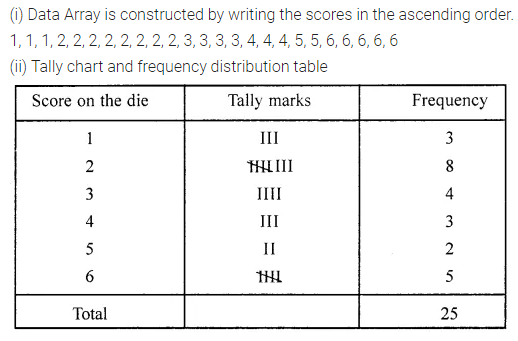
(x) The frequency of 8 is written symbolically as ………… using tally marks.
(xi) In a bar graph, the bars are of uniform …………
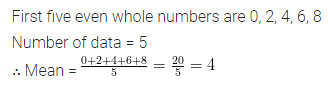
(xii) The mean of the first 8 natural numbers is …………
Solution:
Question 2.
State whether the following statements are true (T) or false (F):
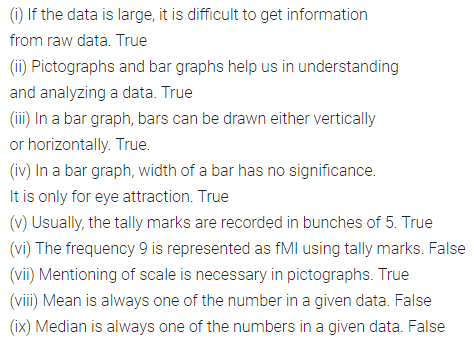
(i) If the data is large, it is difficult to get information from raw data.
(ii) Pictographs and bar graphs help us in understanding and analyzing a data.
(iii) In a bar graph, bars can be drawn either vertically or horizontally.
(iv) In a bar graph, width of a bar has no significance. It is only for eye attraction.
(v) Usually, the tally marks are recorded in bunches of 5.
(vi) The frequency 9 is represented as filtlll using tally marks.
(vii) Mentioning of scale is necessary in pictographs.
(viii) Mean is always one of the number in a given data.
(ix) Median is always one of the numbers in a given data.
Solution:
Multiple Choice Questions
Observe the following pictograph which shows the number of ice cream cones sold by school canteen during a week. Chose the correct answer from the given options for questions 3 to 7:
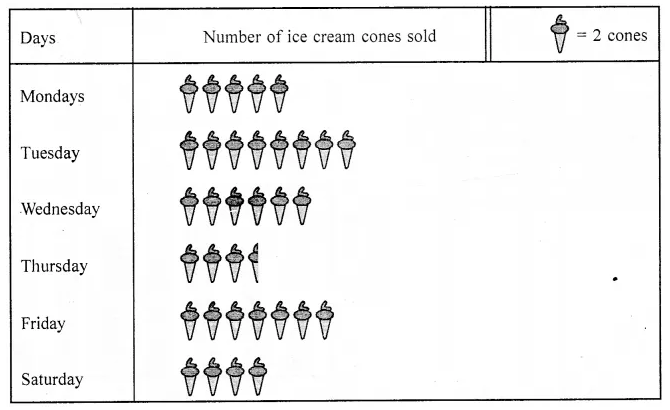
Question 3.
The minimum number of ice cream cones were sold on:
(a) Monday
(b) Saturday
(c) Tuesday
(d) Thursday
Solution:
Thursday (d)
Question 4.
The maximum number of ice cream cones were sold on:
(a) Tuesday
(b) Friday
(c) Wednesday
(d) Thursday
Solution:
Tuesday (a)
Question 5.
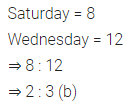
Ratio of the number of ice cream cones sold on Saturday to the number of ice cream cones sold on Wednesday is.
(a) 3 : 2
(b) 2 : 3
(c) 4 : 5
(d) 4 : 7
Solution:

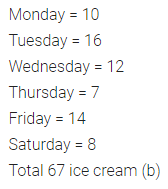
Question 6.
Total number of ice cream cones sold during the whole week was:
(a) 33
(b) 67
(c) 65
(d) 57
Solution:
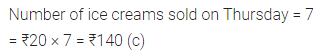
Question 7.
If the cost of one ice cream cone is ₹20, then the sale value on Thursday was:
(a) ₹70
(b) ₹100
(c) ₹140
(d) ₹1340
Solution:
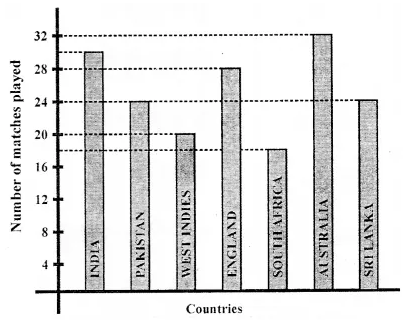
Observe the adjoining bar graph, showing the number of one-day international matches played by cricket teams of different countries. Choose the correct answer from the given four options for questions 8 to 11:

Question 8.
Which country played a maximum number of matches?
(a) India
(b) England
(c) Pakistan
(d) Australia
Solution:
Australia (d)
Question 9.
How many matches did South Africa play?
(a) 16
(b) 18
(c) 20
(d) 24
Solution:
18 (b)
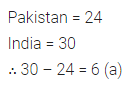
Question 10.
How many more matches were played by India than Pakistan?
(a) 6
(b) 12
(c) 24
(d) 30
Solution:

Question 11.
Ratio of the number of matches played by India to the number of matches played by Sri Lanka is
(a) 4 : 5
(b) 5 : 4
(c) 4 : 3
(d) 7 : 6
Solution:

Choose the correct answer from the given four options for questions 12 and 13:
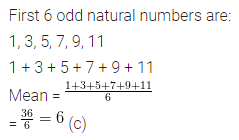
Question 12.
The mean of the first 6 odd natural numbers is
(a) 5
(b) 5.5
(c) 6
(d) 6.5
Solution:
Question 13.
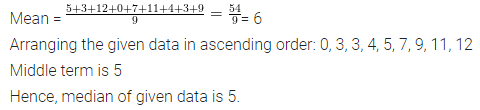
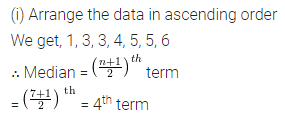
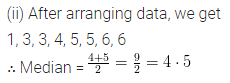
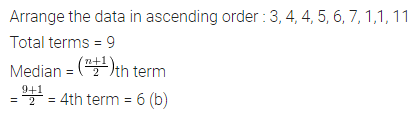
The median of the numbers 4, 4, 7, 5, 7, 6, 1, 3, 11 is
(a) 7
(b) 6
(c) 5
(d) 4
Solution:
ML Aggarwal Class 6 Solutions for ICSE Maths Chapter 15 Data Handling Objective Type Questions
Mental Maths
Question 1.
Fill in the blanks:
(i) A ……. is a collection of numerical figures to give some information.
(ii) Each numerical figure in data is called an ………..
(iii) The number of times a particular observation occurs in a data is called … of the observation.
(iv) A data arranged in ascending or descending order is called an ………… data.
(v) A pictorial representation of a data is called a …………
(vi) If  represent 5 students then
  represent ………… students.
(vii) In a pictograph, if one bicycle represents 20 bicycles then 140 bicycles can be represented by ………… bicycles.
(viii)In a pictograph, if one electric bulb represents 10 bulbs then the picture of half a bulb will represent ………… bulbs.
(ix) In a pictograph, if the symbol  represents 50 fruits baskets, then
 represent ………… fruit baskets.
(x) The frequency of 8 is written symbolically as ………… using tally marks.
(xi) In a bar graph, the bars are of uniform …………
(xii) The mean of the first 8 natural numbers is …………
Solution:

Question 2.
State whether the following statements are true (T) or false (F):
(i) If the data is large, it is difficult to get information from raw data.
(ii) Pictographs and bar graphs help us in understanding and analyzing a data.
(iii) In a bar graph, bars can be drawn either vertically or horizontally.
(iv) In a bar graph, width of a bar has no significance. It is only for eye attraction.
(v) Usually, the tally marks are recorded in bunches of 5.
(vi) The frequency 9 is represented as filtlll using tally marks.
(vii) Mentioning of scale is necessary in pictographs.
(viii) Mean is always one of the number in a given data.
(ix) Median is always one of the numbers in a given data.
Solution:

Multiple Choice Questions
Observe the following pictograph which shows the number of ice cream cones sold by school canteen during a week. Chose the correct answer from the given options for questions 3 to 7:

Question 3.
The minimum number of ice cream cones were sold on:
(a) Monday
(b) Saturday
(c) Tuesday
(d) Thursday
Solution:
Thursday (d)
Question 4.
The maximum number of ice cream cones were sold on:
(a) Tuesday
(b) Friday
(c) Wednesday
(d) Thursday
Solution:
Tuesday (a)
Question 5.
Ratio of the number of ice cream cones sold on Saturday to the number of ice cream cones sold on Wednesday is.
(a) 3 : 2
(b) 2 : 3
(c) 4 : 5
(d) 4 : 7
Solution:
Question 6.
Total number of ice cream cones sold during the whole week was:
(a) 33
(b) 67
(c) 65
(d) 57
Solution:

Question 7.
If the cost of one ice cream cone is ₹20, then the sale value on Thursday was:
(a) ₹70
(b) ₹100
(c) ₹140
(d) ₹1340
Solution:

Observe the adjoining bar graph, showing the number of one-day international matches played by cricket teams of different countries. Choose the correct answer from the given four options for questions 8 to 11:
Question 8.
Which country played a maximum number of matches?
(a) India
(b) England
(c) Pakistan
(d) Australia
Solution:
Australia (d)
Question 9.
How many matches did South Africa play?
(a) 16
(b) 18
(c) 20
(d) 24
Solution:
18 (b)
Question 10.
How many more matches were played by India than Pakistan?
(a) 6
(b) 12
(c) 24
(d) 30
Solution:
Question 11.
Ratio of the number of matches played by India to the number of matches played by Sri Lanka is
(a) 4 : 5
(b) 5 : 4
(c) 4 : 3
(d) 7 : 6
Solution:
Choose the correct answer from the given four options for questions 12 and 13:
Question 12.
The mean of the first 6 odd natural numbers is
(a) 5
(b) 5.5
(c) 6
(d) 6.5
Solution:

Question 13.
The median of the numbers 4, 4, 7, 5, 7, 6, 1, 3, 11 is
(a) 7
(b) 6
(c) 5
(d) 4
Solution: