RS Aggarwal Solutions Class 10 Chapter 9 Mean, Median, Mode of Grouped Data,Cumulative Frequency Graph and O give Test Yourself
These Solutions are part of RS Aggarwal Solutions Class 10. Here we have given RS Aggarwal Solutions Class 10 Chapter 9 Mean, Median, Mode of Grouped Data,Cumulative Frequency Graph and O give Test Yourself.
Other Exercises
- RS Aggarwal Solutions Class 10 Chapter 9 Mean, Median, Mode of Grouped Data Ex 9a
- RS Aggarwal Solutions Class 10 Chapter 9 Mean, Median, Mode of Grouped Data Ex 9b
- RS Aggarwal Solutions Class 10 Chapter 9 Mean, Median, Mode of Grouped Data Ex 9c
- RS Aggarwal Solutions Class 10 Chapter 9 Mean, Median, Mode of Grouped Data Ex 9d
- RS Aggarwal Solutions Class 10 Chapter 9 Mean, Median, Mode of Grouped Data Ex 9e
- RS Aggarwal Solutions Class 10 Chapter 9 Mean, Median, Mode of Grouped Data Ex 9f
- RS Aggarwal Solutions Class 10 Chapter 9 Mean, Median, Mode of Grouped Data MCQ
- RS Aggarwal Solutions Class 10 Chapter 9 Mean, Median, Mode of Grouped Data Test Yourself
Question 1.
Solution:
Correct option: (b)
The cumulative frequency table is useful in determining the median.
Question 2.
Solution:
Correct option: (c)
Mean = 27
Median = 33
Mode = 3Median – 2Mean
= 3 x 33 – 2 x 27
= 99 – 54
= 45
The Mean Median Calculator is used to calculate the count, sum, mean, median, mode and range of a set of numbers.
Question 3.
Solution:

Question 4.
Solution:

Question 5.
Solution:

Question 6.
Solution:
Number of athletes who completed the race in less than 14.6 seconds
= 2 + 4 + 15 + 54
= 75.
Question 7.
Solution:

Question 8.
Solution:
The frequency table is as follows:
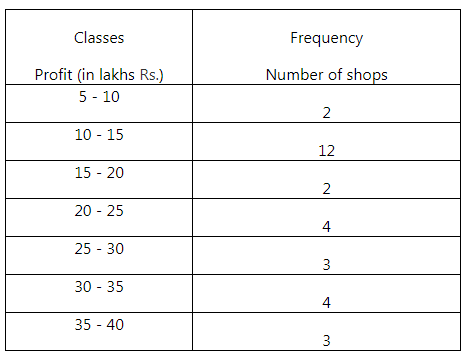
The frequency corresponding to the class 20 – 25 is 4.
Question 9.
Solution:

Question 10.
Solution:

Question 11.
Solution:

Question 12.
Solution:

Question 13.
Solution:
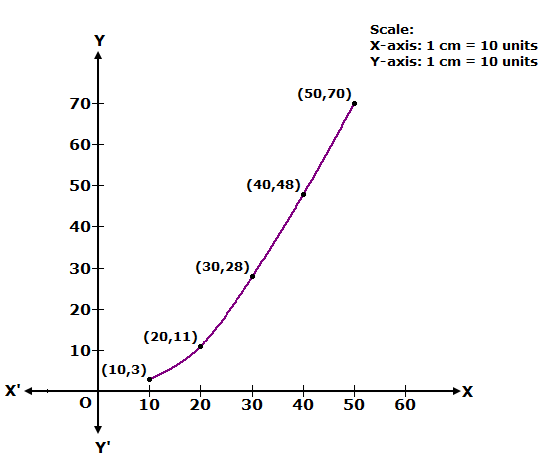
We plot the points (10, 3), (20, 11), (30, 28), (40, 48) and (50, 70) to get the cumulative frequency curve as follows:
Question 14.
Solution:

Question 15.
Solution:
We plot the points (20, 2), (30, 7), (40, 17), (50, 40), (60, 60), (70, 82), (80, 85), (90, 90) and (100, 100) to get the cumulative frequency curve as follows:
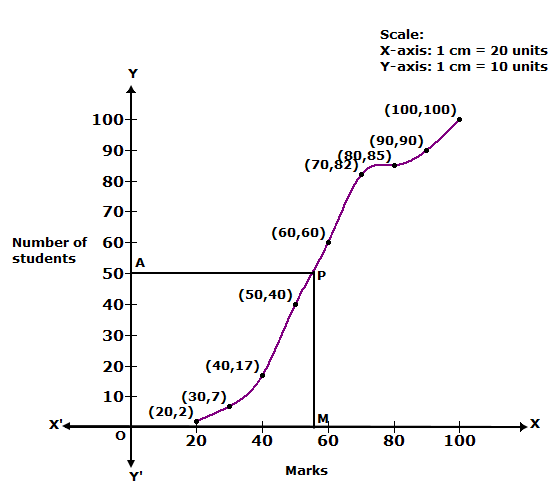
Here, N = 100 ⇒ N/2 = 50
At y = 50, affix A.
Through A, draw a horizontal line meeting the curve at P.
Through P, a vertical line is drawn which meets OX at M.
OM = 56.
Hence, median = 56
Question 16.
Solution:

Question 17.
Solution:

Question 18.
Solution:

Question 19.
Solution:

Question 20.
Solution:
Less Than Series:
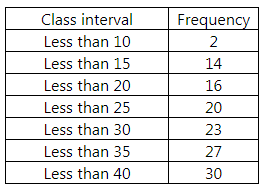
We plot the points (10, 2), (15, 14), (20, 16), (25, 20), (30, 23), (35, 27) and (40, 30) to get less than ogive.
More Than Series:
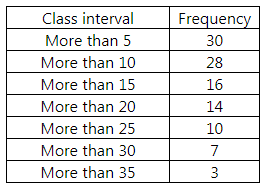
We plot the points (5, 30), (10, 28), (15, 16), (20, 14), (25, 10), (30, 7) and (35, 3) to get more than ogive.
–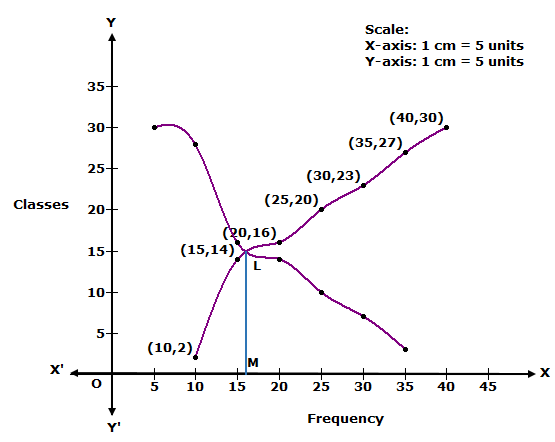
The two curves intersect at L. Draw LM ⊥ OX.
Thus, median = OM = 16.
Question 21.
Solution:
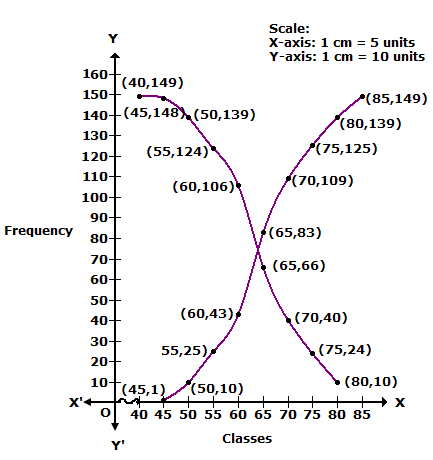
Less Than Series:
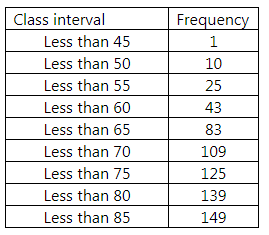
We plot the points (45, 1), (50, 10), (55, 25), (60, 43), (65, 83), (35, 27), (70, 109), (75, 125), (80, 139) and (85, 149) to get less than ogive.
More Than Series:
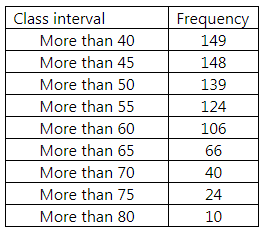
We plot the points (40, 149), (45, 148), (50, 139), (55, 124), (60, 106), (65, 66), (70, 40), (75, 24) and (80, 10) to get more than ogive.
—
Question 22.
Solution:

We hope the RS Aggarwal Solutions Class 10 Chapter 9 Mean, Median, Mode of Grouped Data Test Yourself help you. If you have any query regarding RS Aggarwal Solutions Class 10 Chapter 9 Mean, Median, Mode of Grouped Data Test Yourself, drop a comment below and we will get back to you at the earliest.