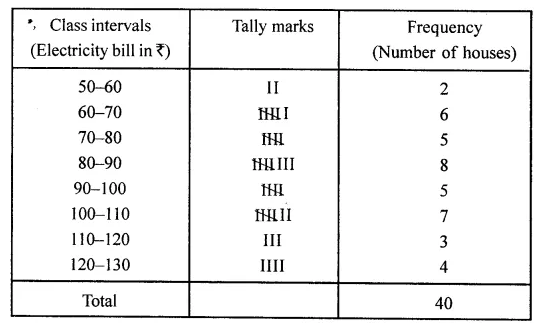
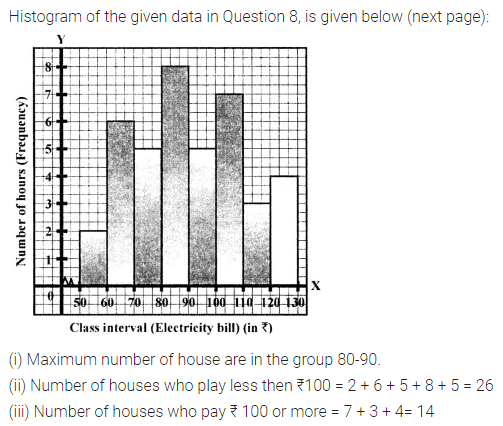
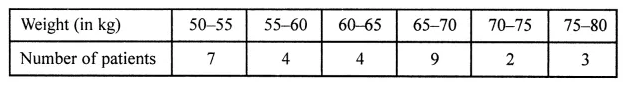
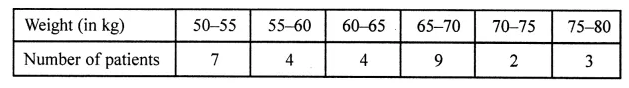
ML Aggarwal Class 8 Solutions for ICSE Maths Chapter 19 Data Handling Check Your Progress
Question 1.
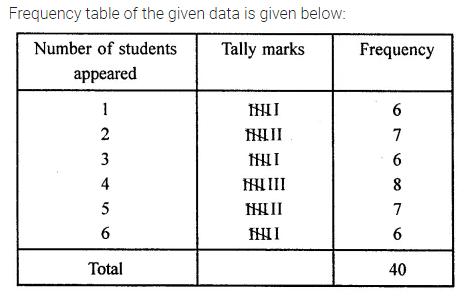
Each student from the group of 40 students was asked to roll a dice independently. The results are given below:
2, 3, 3, 4, 1, 5, 2, 6, 1, 4, 2, 3, 4, 4, 6, 1, 5, 5, 2, 4, 5, 5, 3, 1, 6, 5, 4, 2, 3, 6, 1, 1, 4, 4, 5, 3, 2, 2, 6,6
Make a frequency distribution table for the same.
Solution:
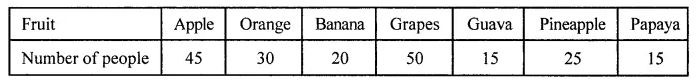
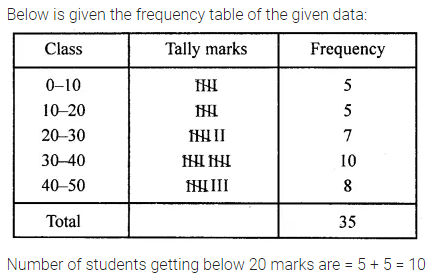
Question 2.
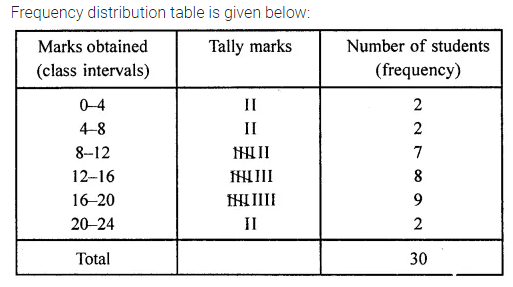
The marks obtained by 30 students of a class in a test of maximum marks 20 are as follows:
15, 11, 12, 10, 9, 8, 19, 13, 16, 3, 2, 17, 18, 19, 14, 6, 20, 15, 16, 12, 10, 4, 9, 8, 12, 17, 18, 20, 19, 12.
Prepare a frequency distribution table for the above data using class intervals 0-4, 4-8 and so on.
Solution:
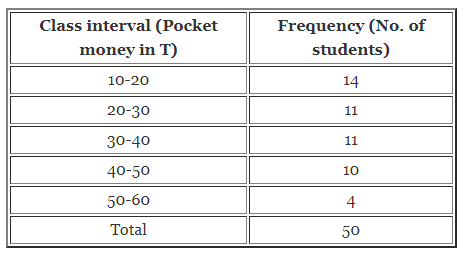
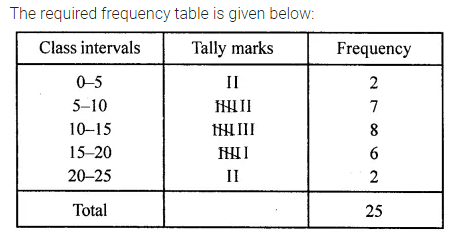
Question 3.
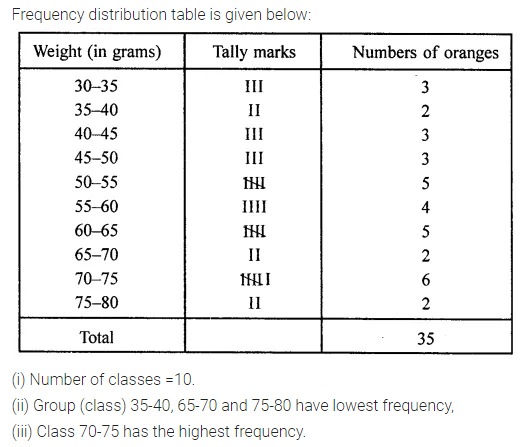
Construct a frequency distribution table for the following weights (in grams) of 35 oranges, using class intervals 40—45, 45-50 and so on.
30, 40, 45, 32, 43, 50, 55, 63, 72, 73, 62, 61, 54, 53, 50, 43, 76, 38, 54, 55, 66, 70, 74, 75, 45, 47, 59, 58, 60, 63, 74, 33, 35, 70, 68.
(i) How many classes are there in the frequency distribution table?
(ii) Which weight group has the lowest frequency?
(iii) Which weight group has the highest frequency?
Solution:
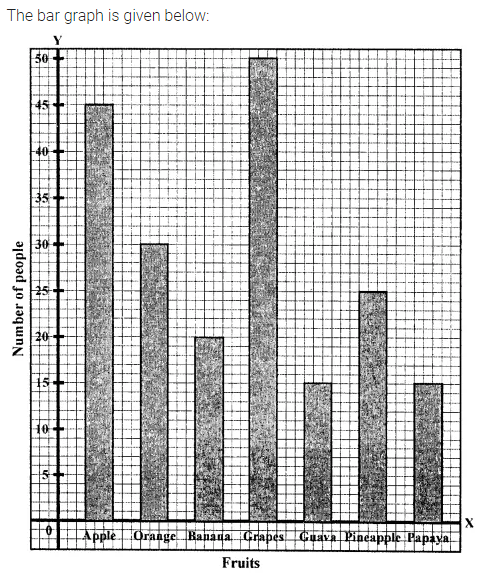
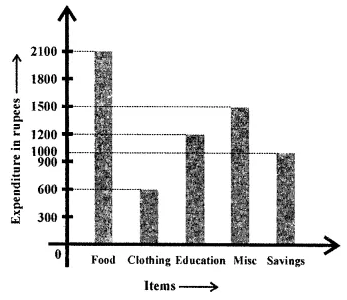
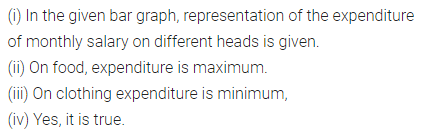
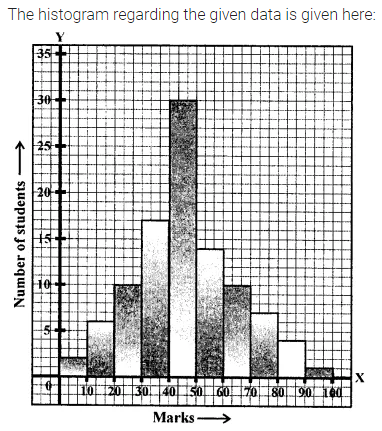
Question 4.
Draw a histogram of the following data:
Marks obtained by students in a Mathematics Paper of maximum marks 100.
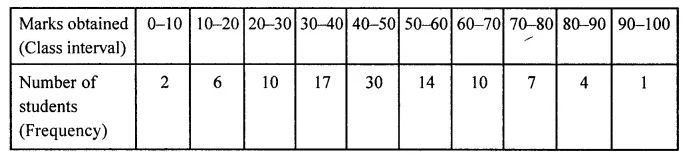
Solution:
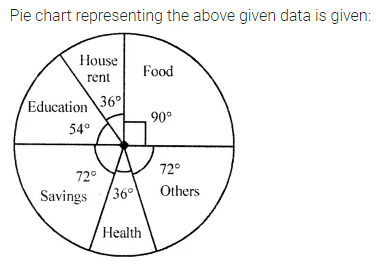
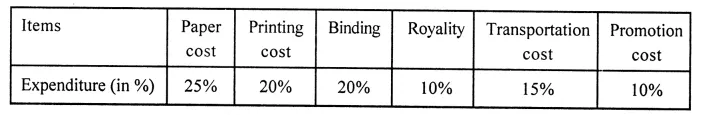
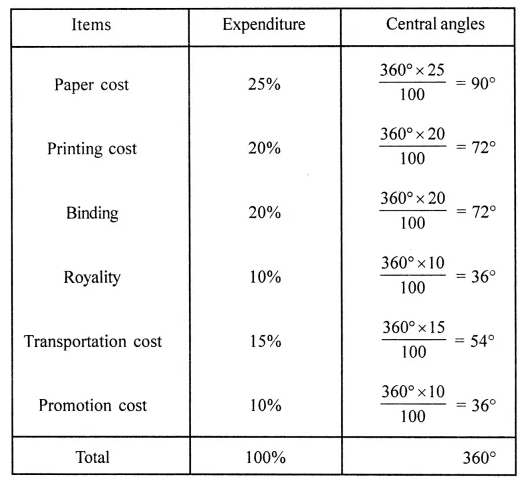
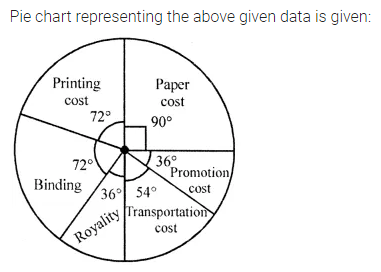
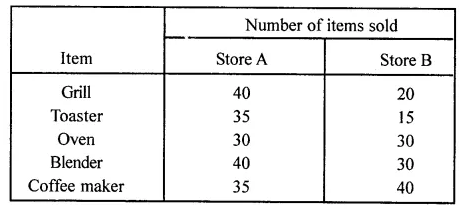
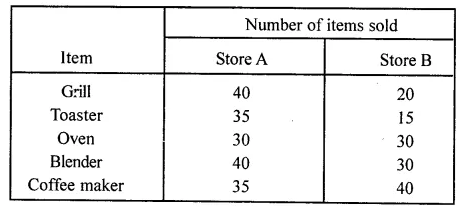
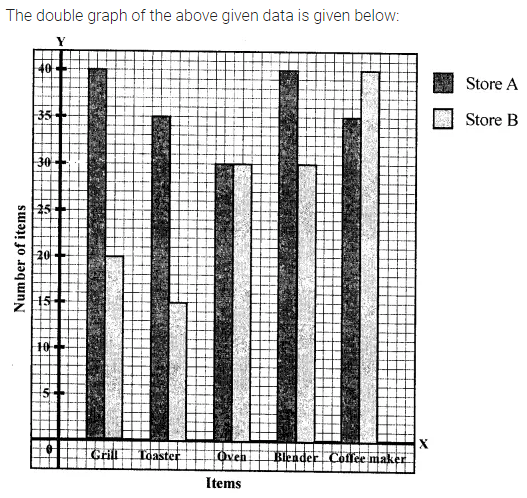
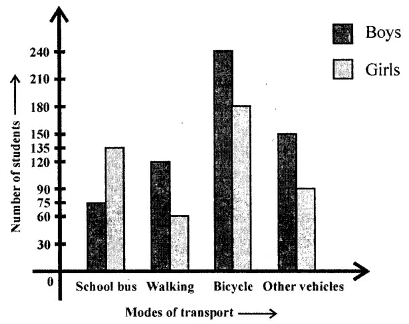
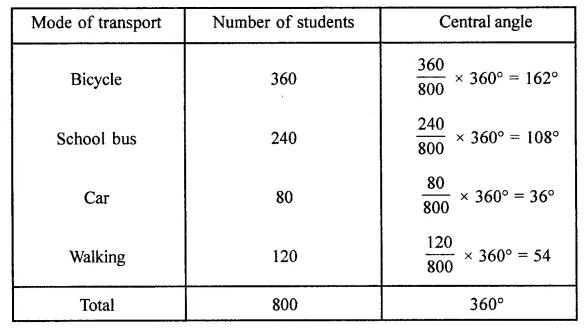
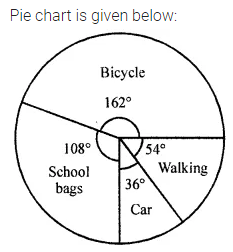
Question 5.
The following data represents the number of students using a different mode of transportation to come to school.
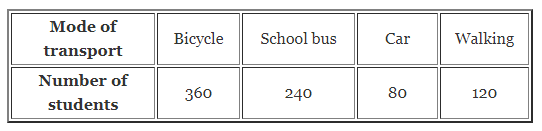
Draw a pie chart to represent this data Pie chart is given below:
Solution:
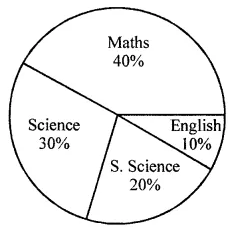
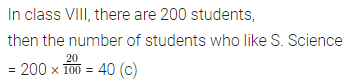
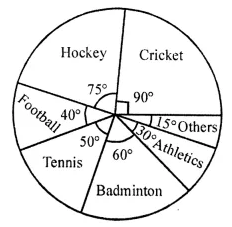
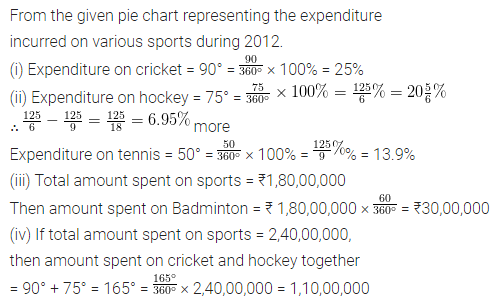
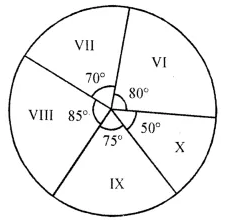
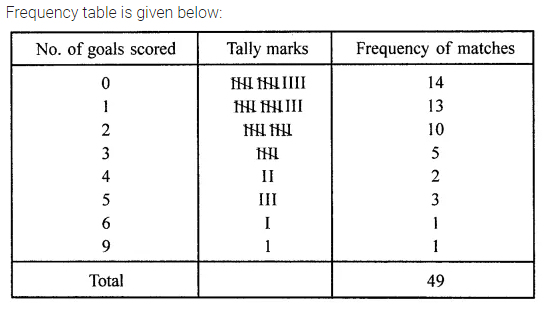
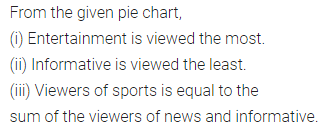
Question 6.
Answer the following questions based on the pie chart given below:
(i) Which type of programmes are viewed the most?
(ii) Which type of programmes are viewed the least?
(iii) Which two types of programmes have number of viewers equal to those watching sports channels?
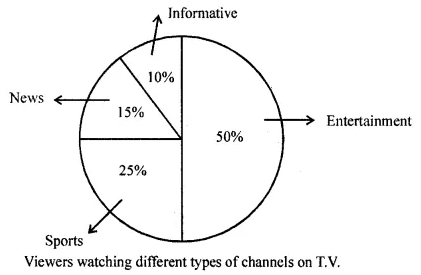
Solution:
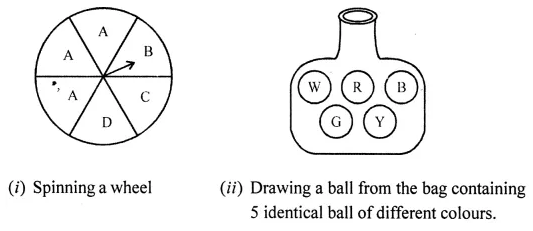
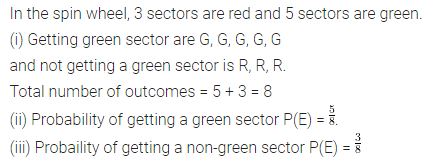
Question 7.
Suppose you spin the wheel shown in adjoining figure.
(i) List the outcomes of getting a green sector and not getting a green sector on this wheel.
(ii) Find the probability of getting a green sector.
(iii) Find the probability of not getting a green sector.
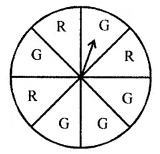
Solution:
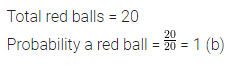
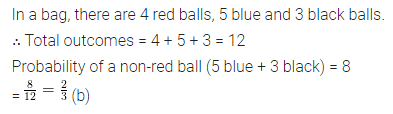
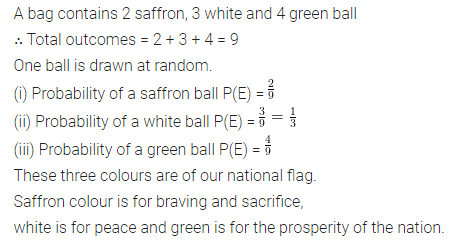
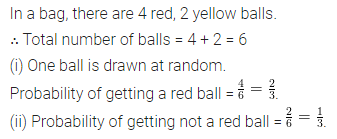
Question 8.
A bag has 4 red and 2 yellow balls. A ball is drawn from the bag without looking into the bag. What is the probability of getting
(i) a red ball?
(ii) not a red ball?
Solution:
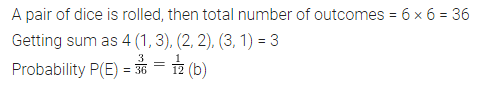
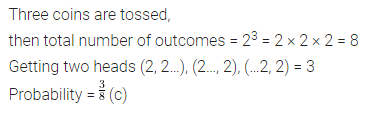
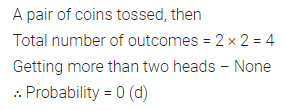
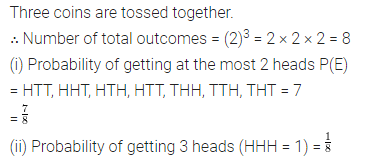
Question 9.
Three coins are tossed together, find the probability of getting
(i) atmost 2 heads
(ii) 3 heads.
Solution:
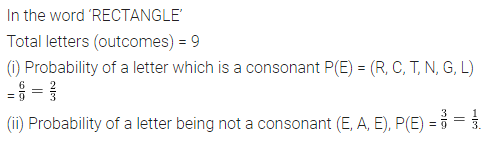
Question 10.
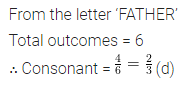
A letter is chosen from the word ‘RECTANGLE’. What is the probability that it is
(i) a consonant
(ii) not a consonant.
Solution: