NCERT Solutions for Class 10 Social Science Geography Chapter 7 Lifelines of National Economy

NCERT Solutions for Class 10 Social Science Geography Chapter 7 Lifelines of National Economy

These Solutions are part of NCERT Solutions for Class 10 Social Science. Here we have given NCERT Solutions for Class 10 Social Science Geography Chapter 7 Lifelines of National Economy.

TEXTBOOK EXERCISES

Question 1.

  1. Which are the extreme locations connected by the East-West Corridor?
  2. Which mode of transportation reduces trans-shipment losses and delays?
  3. State two states which are connected with the HVJ pipeline.
  4. Which port is the deepest land-locked and well-protected port along the east coast?
  5. Which is the most important mode of transportation in India?
  6. Which term is used to describe trade between two or more countries?

Answer:

  1. Silchar and Porbandar.
  2. Pipeline.
  3. Madhya Pradesh, Gujarat, and Uttar Pradesh.
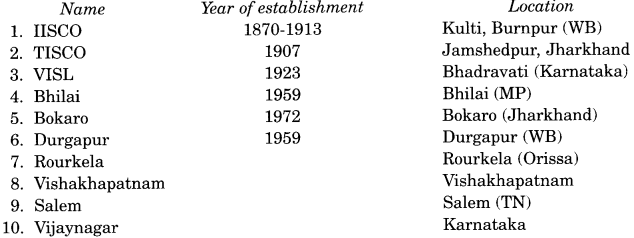
  4. Vishakhapatnam.
  5. Railways.
  6. International trade.

Question 2(1).
Answer the following questions in about 30 words :
(1) State merits of roadways.
Answer:
(1) Merits of roadways: India has one of the largest road networks in the world. It is about 2.3 million km at present. In India roads were built earlier than the railways which were started in 1853.

The merits of roadways are as mentioned below :

  1. The construction cost of roads is much lower than that of railway lines,
  2. Roads can traverse dissected and undulating topography and
  3. Roads can negotiate higher gradients of slopes. and as such can traverse mountains such as the Himalayas.

Question 2(2).
Where and why is rail transport the most convenient means of transportation?
Answer:
Railways make it possible to conduct different activities like business, sightseeing, and pilgrimage along with transportation of goods over longer distances. Apart from an important means of transport, the Indian Railways have been a great integrating force for more than 150 years. Railways in India bind the economic life of the country as well as accelerate the development of the industry and agriculture.

Question 2(3).
What is the significance of the border roads?
Answer:
The Roads Organization, (a Government of India undertaking) constructs and maintains roads in the bordering areas of the country. This organization was established in 1960 for the development of the roads of strategic importance in the northern and north-eastern border areas. These roads have improved accessibility in areas of difficult terrain and have helped in the economic development of these areas.

Question 2(4).
What is meant by trade? What is the difference between international and local trade?
Answer:
The exchange of goods among people, states, and countries is referred to as a trade. The market is the place where such exchanges take place. Trade between the two countries is called international trade. It may take place across the sea, air or land. While local trade is carried on in cities, towns, and villages, state-level trade is carried between two or more states.

Question 3.
Answer the following questions in about 120 words :

(1) Why are the means of transportation and communication called the lifelines of a nation and
its economy?
(2) Write a note on the changing nature of international trade in the last fifteen years.
Answer:
(1) The means of transportation and communication are called the lifelines of a nation and its economy due to reasons as mentioned below :

  1. The transport system helps in the movement of goods and services from their supply locations to demand locations.
  2. The means of transport provide an important link between the producers and consumers
    of goods/products.
  3. They help in the development of agriculture and industry by providing raw materials and
    distributing finished goods.
  4. A well-built transport system brings people from different regions within the country and world closer to one another. This promotes interdependencies between them.
  5. With the development of science and technology, the area of influence of trade and transport has expanded far and wide. Different countries, geographically far from each other, are now engaged in trade relations.
  6. With the advanced system of communication, India is connected with the rest of the world. Its flourishing international trade has added vitality to its economy and enriched the lives of the people by raising their living standards.
  7. Transport like railways helps us in conducting various activities like business, sightseeing, pilgrimage, and transportation of goods over longer distances.
  8. Pipelines are used for transporting crude oil and natural gas to refineries and factories.
  9. Waterways provide the cheapest means of transport.
  10. Air transport provides the fastest, most comfortable mode of transport.A dense and efficient network of transport and communication are pre-requisites for fast development as well as national and global trade of today. Thus modem means of transport and communication serve as lifelines of our nation and its modern economy.

(2) India has trade relations with all the major trading blocks and all geographical regions of the world. Among the commodities of export, whose share has been increasing over the last few years till 2004-05 are, agriculture and allied products (2.53 percent), ores and minerals (9.12 percent), gems and jewellery (26.75 percent), chemical and allied products (24.45 percent), engineering goods( 35.63 percent) and petroleum products (86.12 percent) The commodities imported to India include petroleum, petroleum products (41.87 percent), pearls, precious stones (29.26 percent), inorganic chemicals (29.39 percent), coal, coke, briquettes (94.17 percent), machinery (12.56 percent).

Bulk imports as a group registered a growth accounting for 39.09 percent of total imports. This group includes fertilizers (67.01 percent), cereals (25.23 percent), edible oils (7.94 percent), and newsprint (5.51 percent). International trade has undergone a sea change in the last fifteen years. The exchange of commodities and goods have been superseded by the exchange of information and knowledge. India has emerged as a software giant at the international level. It is earning large foreign exchange through the export of information technology.

We hope the NCERT Solutions for Class 10 Social Science Geography Chapter 7 Lifelines of National Economy help you. If you have any query regarding NCERT Solutions for Class 10 Social Science Geography Chapter 7 Lifelines of National Economy, drop a comment below and we will get back to you at the earliest.

NCERT Solutions for Class 10 Social Science Geography Chapter 6 Manufacturing Industries

NCERT Solutions for Class 10 Social Science Geography Chapter 6 Manufacturing Industries

These Solutions are part of NCERT Solutions for Class 10 Social Science. Here we have given NCERT Solutions for Class 10 Social Science Geography Chapter 6 Manufacturing Industries.

TEXTBOOK EXERCISES

l. Very Short Answer Questions :

Question 1.

(a) Which industry uses limestone as a raw material ?
(b) Which agency markets steel for the public sector plants ?
(c) Which industry uses bauxite as a raw material ?
(d) Which industry manufactures telephones, computer etc.
Answer:

(a) Cement.
(b) Sail.
(c) Aluminium.
(d) Electronic industry.

Question 2.
Answer the following briefly in not more than 30 words :

  1. What is manufacturing?
  2. Name any three physical factors for the location of the industry.
  3. Name any three human factors for the location of an industry.
  4. What are the basic industries? Give an example.
  5. Name the important raw materials used in the manufacturing of cement?

Answer:

  1. Production of goods in large quantities after processing from raw materials to more
    valuable products is called manufacturing. For example, the paper is manufactured from wood, sugar from sugarcane and steel from iron ore, and aluminium from bauxite.
  2. Three physical factors for the location of the industry are as given below :
    • Near to the raw material.
    • Nearness to power i.e., sources of power generation.
    • Climate particularly in the establishment of agro-based industries like cotton and jute textile.
  3. Three human factors for the location of an industry are as mentioned below :
    • Labour – It may be skilled or unskilled.
    • Transport facilities – Good transport is needed to bring the raw material to the industries as well as to take finished goods to the market.
    • Demands for goods – There should be demands for goods so that the goods may be purchased and consumed. Some goods may ribbed to the good purchasing power of the people around the industries.
  4. Basic industries are those industries which supply their products or raw materials to manufacture other goods e.g., iron and steel and copper smelting, aluminium smelting industries.
  5. The important raw materials used in the manufacturing of cement are limestone, silica, alumina, and gypsum.

Question 3.
Write the answers to the following questions in 120 words :
(1) How are integrated steel plants different from mini steel plants? What problems does the industry face? What recent developments have led to a rise in production capacity?
(2) How do industries pollute the environment?
(3) Discuss the steps to be taken to minimise environmental degradation by industry? [CBSE 2016]
Answer:
(1)

  1. Integrated steel plants are large.
  2. They handle everything in one complex – from putting together raw material to steel making, rolling and shaping.
  3. These plants manufacture everything from alloy to steel.

NCERT Solutions for Class 10 Social Science Geography Chapter 6 Manufacturing Industries 1

(2) Mini Steel Plants :

  1. Mini steel plants are smaller, have electric furnaces, use steel scrap and sponge iron.
  2. They have re-rollers that use steel ingots as well,
  3. They produce mild and alloy steel of given specifications.

(3) The following problems are being faced by this industry —

  1. High costs and limited availability of coking coal,
  2. Lower productivity of labour
  3. Irregular supply of energy and
  4. Poor infrastructure.

(4)

(1) Liberalisation and Foreign Direct Investment have led to a rise in the production capacity of steel industry. Efforts of private entrepreneurs have given a boost to the industry. However, there is a need to allocate resources for research and development to produce steel more competitively.

(2) Industries have increased pollution and degraded environment. Industries create four types of pollution, namely, air, water, thermal and noise. These are explained as given below :

1. Air pollution :
The smoke emitted by til’s industries pollute air and water badly.

  1. Air pollution is caused by the presence of high proportion of undesirable gases such as sulphur dioxide and carbon monoxide.
  2. Air borne particulate materials contain both solid and liquid particles such as dust, sprays mist and smoke.
  3. Smoke is emitted by chemical and paper factories, brick kilns, refineries and smelting plants, and burning of fossil fuels in big and small factories that ignore pollution norms.
  4. The gas leaks can be very hazardous with long term effects. For example, Bhopal Gas tragedy killed hundreds of people and adversely affected human health, animals, plants etc. as a whole.

2. Water pollution :

  1. The industrial effluents, both organic and inorganic, are discharged into rivers. They pollute the water.
  2. Coal dyes, soaps, pesticides, fertilisers are some common pollutants of water.
  3. The main industries that pollute water are paper, pulp, textiles, chemical, petroleum and electroplating.
  4. These industries let out dyes, detergents, acids, salts and heavy metals like lead and mercury pesticides into the water bodies.
    Fly ash, phospho-gypsum and iron and steel slags are the major solid wastes in India.

3.Thermal pollution :

  1. Thermal pollution of water occurs when hot water from factories and thermal plants is drained into the rivers and ponds before cooling.
  2. Wastes from nuclear power plants, nuclear and weapon production facilities cause cancers, birth defects and miscarriages.
  3. Dumping of wastes specially glass, harmful chemicals, industrial affluents, packagings, salts and garbage renders the soil useless.
  4. Rain water percolates to the soil carrying the pollutants to the ground and the groundwater also gets contaminated

4. Noise pollution :

  1. Industrial and construction activities, machinery, factory equipment, generators, saws and other equipment make a lot of noise which have bad effects on human beings.
  2. It can cause hearing impairment, increased heart rate and blood pressure among other physiological effects.
  3. Unwanted sound is an irritant and a source of stress.

(3) Steps to be taken to minimise environmental degradation by the industry. Some suggestions to minimise environmental degradation are given below :

  1. To minimise use of water for processing by reusing and recycling it in two or more successive stages.
  2. Harvesting of rainwater to meet water requirements.
  3. Treating hot water and effluents before releasing them in rivers and ponds.
  4. Treatment of industrial effluents can be done in three phases as given below :
    1. Primary treatment by mechanical means. This involves screening, grinding, flocculation and sedimentation.
    2. Secondary treatment by biological process.
    3. Tertiary treatment by biological, chemical and physical processes. This involves recycling of waste water.
  5. There should be careful planning, siting of industries, better design equipment and better operation of the equipment.
  6. Overdrawing of groundwater reserves should be regulated legally.
  7. Particulate matter in the air can be reduced by fitting smoke stacks to factories with electrostatic precipitators, fabric filters, scrubbers and inertial separators.
  8. Smoke can be reduced by using oil or gas instead of coal in factories.
  9. Machinery and equipment can be used and generators should be fitted with silencers.
  10. Almost all machinery can be redesigned to increase energy efficiency and reduce
    noise.
  11. Noise absorbing material may be used apart from personal use of earplugs and earphones.

Question 4.
Give one word for each of the following with regard to industry. The number of letters in each word are hinted in brackets.
NCERT Solutions for Class 10 Social Science Geography Chapter 6 Manufacturing Industries 2

Answer:

(i) Power
(ii) Worker
(iii) Market
(iv) Retailer
(v) Product
(vi) Manufacture
(vii) Pollution.

Question 5.
Solve the puzzle by following your search horizontally and vertically to find the hidden answers.
1. Textiles, sugar, vegetable oil and plantation industries deriving raw materials from agriculture are called.
2. The basic raw material for sugar industry.
3. This fibre is also known as the ‘Golden Fibre’.
4. Iron-ore, coking coal, and limestone are the chief raw materials of this industry.
5. A public sector steel plant located in Chhattisgarh.
6. Railway diesel engines are manufactured in Uttar Pradesh at this place.
NCERT Solutions for Class 10 Social Science Geography Chapter 6 Manufacturing Industries 3
Answer:

  1. Agro-based
  2. Sugarcane
  3. Jute
  4. Iron Steel
  5. Bhilai
  6. Varanasi.

We hope the NCERT Solutions for Class 10 Social Science Geography Chapter 6 Manufacturing Industries help you. If you have any query regarding NCERT Solutions for Class 10 Social Science Geography Chapter 6 Manufacturing Industries, drop a comment below and we will get back to you at the earliest.

RS Aggarwal Solutions Class 10 Chapter 9 Mean, Median, Mode of Grouped Data MCQ

RS Aggarwal Solutions Class 10 Chapter 9 Mean, Median, Mode of Grouped Data,Cumulative Frequency Graph and O give MCQ

These Solutions are part of RS Aggarwal Solutions Class 10. Here we have given RS Aggarwal Solutions Class 10 Chapter 9 Mean, Median, Mode of Grouped Data,Cumulative Frequency Graph and O give MCQ.

Other Exercises

Question 1.
Solution:
Correct option: (d)
Range is not a measure of central tendency.

Question 2.
Solution:
Correct option: (a)
Mean cannot be determined graphically.

Question 3.
Solution:
Correct option: (a)
Since mean is the average of all observations, it is influenced by extreme values.

Question 4.
Solution:
Correct option: (c)
Mode can be obtained graphically from a histogram.

Question 5.
Solution:
Correct option: (d)
Ogives are used to determine the median of a frequency distribution.

Question 6.
Solution:
Correct option: (b)
The cumulative frequency table is useful in determining the median.

Question 7.
Solution:
Correct option: (b)
Median is given by the abscissa of the point of intersection of the Less than Type and More than Type cumulative frequency curves.

Question 8.
Solution:
Correct option: (b)
For a grouped data,
\(\sum { f }_{ i }\left( { x }_{ i }-\bar { x } \right) =0\)

Question 9.
Solution:
Correct option: (b)
By formula method,
\(\bar { x } =\quad A+h\left[ \frac { \sum { { f }_{ i }{ u }_{ i } } }{ \sum { { f }_{ i } } } \right] \)
where \({ u }_{ i }=\quad \frac { \left( { x }_{ i }-A \right) }{ h } \)

Question 10.
Solution:
Correct option: (c)
di‘s are the deviations from A of midpoints of the classes.

Question 11.
Solution:
Correct option: (b)
While computing the mean of the grouped data, we assume that the frequencies are centred at the class marks of the classes.

Question 12.
Solution:
Correct option: (b)
Mode = (3 x median) – (2 x mean)

Question 13.
Solution:
Correct option: (c)
Since the abscissa of the point of intersection of both the ogives gives the median, we have median = 20.5

Question 14.
Solution:
RS Aggarwal Solutions Class 10 Chapter 9 Mean, Median, Mode of Grouped Data MCQ 1

Question 15.
Solution:
Correct option: (c)
Class having maximum frequency is the modal class.
Here, maximum frequency = 30
Hence, the modal class is 30 – 40.

Question 16.
Solution:
Correct option: (b)
Mode = \({ x }_{ k }+h.\left\{ \frac { { f }_{ k }-{ f }_{ k-1 } }{ \left( { 2f }_{ k }-{ f }_{ k-1 }-{ f }_{ k+1 } \right) } \right\} \)

Question 17.
Solution:
Correct option: (a)
Median = \(l+\left\{ h\times \frac { \left( \frac { N }{ 2 } -cf \right) }{ f } \right\} \)

Question 18.
Solution:
Correct option: (c)
Mean = 8.9
Median = 9
Mode = 3Median – 2Mean
= 3 x 9 – 2 x 8.9
= 27 – 17.8
= 9.2.

Question 19.
Solution:
RS Aggarwal Solutions Class 10 Chapter 9 Mean, Median, Mode of Grouped Data MCQ 2

Question 20.
Solution:
RS Aggarwal Solutions Class 10 Chapter 9 Mean, Median, Mode of Grouped Data MCQ 3

Question 21.
Solution:
RS Aggarwal Solutions Class 10 Chapter 9 Mean, Median, Mode of Grouped Data MCQ 4

Question 22.
Solution:
RS Aggarwal Solutions Class 10 Chapter 9 Mean, Median, Mode of Grouped Data MCQ 5

Question 23.
Solution:
Correct option: (c)
For a symmetrical distribution,
we have  
Mean = mode = median

Question 24.
Solution:
Correct option: (c)
Number of families having income more than Rs. 20000 = 50
Number of families having income more than Rs. 25000 = 37
Hence, number of families having income range 20000 to 25000 = 50 – 37 = 13

Question 25.
Solution:
RS Aggarwal Solutions Class 10 Chapter 9 Mean, Median, Mode of Grouped Data MCQ 6

Question 26.
Solution:
Correct option: (d)
Mean of 20 numbers = 0
Hence, sum of 20 numbers = 0 x 20 = 0
Now, the mean can be zero if
sum of 10 numbers is (S) and the sum of remaining 10 numbers is (-S),
sum of 11 numbers is (S) and the sum of remaining 9 numbers is (-S), …….
sum of 19 numbers is (S) and the 20th number is (-S), then their sum is zero.
So, at the most, 19 numbers can be greater than zero.

Question 27.
Solution:
RS Aggarwal Solutions Class 10 Chapter 9 Mean, Median, Mode of Grouped Data MCQ 7

Question 28.
Solution:
RS Aggarwal Solutions Class 10 Chapter 9 Mean, Median, Mode of Grouped Data MCQ 8

Question 29.
Solution:
(a) – (s)
The most frequent value in a data is known as mode.
(b) – (r)
Mean cannot be determined graphically.
(c) – (q)
An ogive is used to determine median.
(d) – (p)
Standard deviation is not a measure of central tendency.

Question 30.
Solution:
RS Aggarwal Solutions Class 10 Chapter 9 Mean, Median, Mode of Grouped Data MCQ 9

Question 31.
Solution:
RS Aggarwal Solutions Class 10 Chapter 9 Mean, Median, Mode of Grouped Data MCQ 10

We hope the RS Aggarwal Solutions Class 10 Chapter 9 Mean, Median, Mode of Grouped Data MCQ help you. If you have any query regarding RS Aggarwal Solutions Class 10 Chapter 9 Mean, Median, Mode of Grouped Data MCQ, drop a comment below and we will get back to you at the earliest.

RS Aggarwal Solutions Class 10 Chapter 9 Mean, Median, Mode of Grouped Data Ex 9f

RS Aggarwal Solutions Class 10 Chapter 9 Mean, Median, Mode of Grouped Data,Cumulative Frequency Graph and O give Ex 9f

These Solutions are part of RS Aggarwal Solutions Class 10. Here we have given RS Aggarwal Solutions Class 10 Chapter 9 Mean, Median, Mode of Grouped Data,Cumulative Frequency Graph and O give Ex 9f.

Other Exercises

Question 1.
Solution:

RS Aggarwal Solutions Class 10 Chapter 9 Mean, Median, Mode of Grouped Data Ex 9f 1

Question 2.
Solution:
Class having maximum frequency is the modal class.
Here, maximum frequency = 27
Hence, the modal class is 40 – 50.
Thus, the lower limit of the modal class is 40.

Question 3.
Solution:
RS Aggarwal Solutions Class 10 Chapter 9 Mean, Median, Mode of Grouped Data Ex 9f 2

Question 4.
Solution:
RS Aggarwal Solutions Class 10 Chapter 9 Mean, Median, Mode of Grouped Data Ex 9f 3

Question 5.
Solution:
RS Aggarwal Solutions Class 10 Chapter 9 Mean, Median, Mode of Grouped Data Ex 9f 4

Question 6.
Solution:
RS Aggarwal Solutions Class 10 Chapter 9 Mean, Median, Mode of Grouped Data Ex 9f 5

Question 7.
Solution:
RS Aggarwal Solutions Class 10 Chapter 9 Mean, Median, Mode of Grouped Data Ex 9f 6

Question 8.
Solution:
RS Aggarwal Solutions Class 10 Chapter 9 Mean, Median, Mode of Grouped Data Ex 9f 7

Question 9.
Solution:
RS Aggarwal Solutions Class 10 Chapter 9 Mean, Median, Mode of Grouped Data Ex 9f 8

Question 10.
Solution:
RS Aggarwal Solutions Class 10 Chapter 9 Mean, Median, Mode of Grouped Data Ex 9f 9

Question 11.
Solution:
RS Aggarwal Solutions Class 10 Chapter 9 Mean, Median, Mode of Grouped Data Ex 9f 10

Question 12.
Solution:
RS Aggarwal Solutions Class 10 Chapter 9 Mean, Median, Mode of Grouped Data Ex 9f 11

Question 13.
Solution:
RS Aggarwal Solutions Class 10 Chapter 9 Mean, Median, Mode of Grouped Data Ex 9f 12

Question 14.
Solution:
RS Aggarwal Solutions Class 10 Chapter 9 Mean, Median, Mode of Grouped Data Ex 9f 13

Question 15.
Solution:
RS Aggarwal Solutions Class 10 Chapter 9 Mean, Median, Mode of Grouped Data Ex 9f 14

Question 16.
Solution:
RS Aggarwal Solutions Class 10 Chapter 9 Mean, Median, Mode of Grouped Data Ex 9f 15

Question 17.
Solution:
RS Aggarwal Solutions Class 10 Chapter 9 Mean, Median, Mode of Grouped Data Ex 9f 16

Question 18.
Solution:
RS Aggarwal Solutions Class 10 Chapter 9 Mean, Median, Mode of Grouped Data Ex 9f 17

Question 19.
Solution:
RS Aggarwal Solutions Class 10 Chapter 9 Mean, Median, Mode of Grouped Data Ex 9f 18

Question 20.
Solution:
RS Aggarwal Solutions Class 10 Chapter 9 Mean, Median, Mode of Grouped Data Ex 9f 19

Question 21.
Solution:
RS Aggarwal Solutions Class 10 Chapter 9 Mean, Median, Mode of Grouped Data Ex 9f 20

Question 22.
Solution:
RS Aggarwal Solutions Class 10 Chapter 9 Mean, Median, Mode of Grouped Data Ex 9f 21

We hope the RS Aggarwal Solutions Class 10 Chapter 9 Mean, Median, Mode of Grouped Data Ex 9f help you. If you have any query regarding RS Aggarwal Solutions Class 10 Chapter 9 Mean, Median, Mode of Grouped Data Ex 9f, drop a comment below and we will get back to you at the earliest.

RS Aggarwal Solutions Class 10 Chapter 9 Mean, Median, Mode of Grouped Data Ex 9e

RS Aggarwal Solutions Class 10 Chapter 9 Mean, Median, Mode of Grouped Data,Cumulative Frequency Graph and O give Ex 9e

These Solutions are part of RS Aggarwal Solutions Class 10. Here we have given RS Aggarwal Solutions Class 10 Chapter 9 Mean, Median, Mode of Grouped Data,Cumulative Frequency Graph and O give Ex 9e.

Other Exercises

Question 1.
Solution:
RS Aggarwal Solutions Class 10 Chapter 9 Mean, Median, Mode of Grouped Data Ex 9e 1

We plot the points (10, 5), (20, 8), (30, 12), (40, 15), (50, 18), (60, 22), (70, 29), (80, 38), (90, 45) and (100, 53) to get the ‘less than type’ ogive as follows:
RS Aggarwal Solutions Class 10 Chapter 9 Mean, Median, Mode of Grouped Data Ex 9e 2
Here, N = 53 ⇒ N/2 = 26.5.
At y = 26.5, affix A.
Through A, draw a horizontal line meeting the curve at P.
Through P, a vertical line is drawn which meets OX at M.
OM = 68 units
Hence, median marks = 68

Question 2.
Solution:
We plot the points (15, 2), (30, 5), (45, 9), (60, 17), (75, 39), (90, 54), (105, 70) and (120, 80) to get the ‘less than type’ ogive as follows:

RS Aggarwal Solutions Class 10 Chapter 9 Mean, Median, Mode of Grouped Data Ex 9e 3
Here, N = 80 ⇒ N/2 = 40.
At y = 40, affix A.
Through A, draw a horizontal line meeting the curve at P.
Through P, a vertical line is drawn which meets OX at M.
OM = 78 units
Hence, median number of wickets = 78

Question 3.
Solution:
RS Aggarwal Solutions Class 10 Chapter 9 Mean, Median, Mode of Grouped Data Ex 9e 4

We plot the points (0, 100), (10, 96), (20, 90), (30, 80), (40, 70), (50, 45), (60, 23) and (70, 5) to get the ‘more than type’ ogive as follows:
RS Aggarwal Solutions Class 10 Chapter 9 Mean, Median, Mode of Grouped Data Ex 9e 5
Here, N = 100 ⇒ N/2 = 50.
At y = 50, affix A.
Through A, draw a horizontal line meeting the curve at P.
Through P, a vertical line is drawn which meets OX at M.
OM = 47 units
Hence, median marks = 47.

Question 4.
Solution:
RS Aggarwal Solutions Class 10 Chapter 9 Mean, Median, Mode of Grouped Data Ex 9e 6

We plot the points (135, 50), (140, 45), (145, 37), (150, 28), (155, 16) and (160, 2) to get the ‘more than type’ ogive as follows:
RS Aggarwal Solutions Class 10 Chapter 9 Mean, Median, Mode of Grouped Data Ex 9e 7
Here, N = 50 ⇒ N/2 = 25.
At y = 25, affix A.
Through A, draw a horizontal line meeting the curve at P.
Through P, a vertical line is drawn which meets OX at M.
OM = 151 units
Hence, median height = 151 cm.

Question 5.
Solution:
RS Aggarwal Solutions Class 10 Chapter 9 Mean, Median, Mode of Grouped Data Ex 9e 8

We plot the points (140, 156), (160, 153), (180, 145), (200, 130), (220, 90), (240, 40) and (260, 10) to get the ‘more than type’ ogive as follows:
RS Aggarwal Solutions Class 10 Chapter 9 Mean, Median, Mode of Grouped Data Ex 9e 9
Here, N = 156 ⇒ N/2 = 78.
At y = 78, affix A.
Through A, draw a horizontal line meeting the curve at P.
Through P, a vertical line is drawn which meets OX at M.
OM = 226 units
Hence, median consumption of electricity = 226 units

Question 6.
Solution:
RS Aggarwal Solutions Class 10 Chapter 9 Mean, Median, Mode of Grouped Data Ex 9e 10

We plot the points (50, 100), (55, 98), (60, 90), (65, 78), (70, 54)and (75, 16) to get the ‘more than type’ ogive as follows:
RS Aggarwal Solutions Class 10 Chapter 9 Mean, Median, Mode of Grouped Data Ex 9e 11
Here, N = 100 ⇒ N/2 = 50.
At y = 50, affix A.
Through A, draw a horizontal line meeting the curve at P.
Through P, a vertical line is drawn which meets OX at M.
OM = 70.5 units
Hence, median production yield = 70.5 kg/ha

Question 7.
Solution:
Less Than Series:

Class interval

Cumulative Frequency

Less than 200

5

Less than 300

11

Less than 400

22

Less than 500

35

Less than 600

40

Less than 700

44

Less than 800

47

Less than 900

49

We plot the points (200, 5), (300, 11), (400, 22), (500, 35), (600, 40), (700, 44), (800, 47) and (900, 49) to get ‘less than type’ ogive.

More Than Series:

Class interval

Frequency

More than 100

49

More than 200

44

More than 300

38

More than 400

27

More than 500

14

More than 600

9

More than 700

5

More than 800

2

We plot the points (100, 49), (200, 44), (300, 38), (400, 27), (500, 14), (600,9), (700, 5) and (800, 2) to get more than ogive.

RS Aggarwal Solutions Class 10 Chapter 9 Mean, Median, Mode of Grouped Data Ex 9e 12

Question 8.
Solution:
More than series

RS Aggarwal Solutions Class 10 Chapter 9 Mean, Median, Mode of Grouped Data Ex 9e 13
We plot the points (400, 230), (450, 210), (500, 175), (550, 135), (600, 103), (650, 79), (700, 52), (750, 34)
RS Aggarwal Solutions Class 10 Chapter 9 Mean, Median, Mode of Grouped Data Ex 9e 14
Hence,N = 230 ⇒ N/2 = 115.
Take a point A(0, 115) on the y-axis and draw AP||x-axis meeting the curve at P, Draw PM ⊥ x-axis intersecting x-axis at M
Then,OM = 590
Hence median = 590.

Question 9.
Solution:
(i) Less than series:

RS Aggarwal Solutions Class 10 Chapter 9 Mean, Median, Mode of Grouped Data Ex 9e 15

Plot the points (5, 2), (10, 7), (15, 13), (20, 21), (25, 31), (30, 56), (35, 76), (40, 94), (45, 98) and (50, 100)
RS Aggarwal Solutions Class 10 Chapter 9 Mean, Median, Mode of Grouped Data Ex 9e 16
Join these points free hand to get the curve representing “less than” cumulative curve.

(ii)From the given table we may prepare the ‘more than’ series as shown below:
RS Aggarwal Solutions Class 10 Chapter 9 Mean, Median, Mode of Grouped Data Ex 9e 17
Now, on the same graph paper as above, we plot the point (0, 100), (5, 98), (10, 93), (15, 87), (20, 79), (25, 69), (30, 44), (35, 24) and (40, 6) and (45, 2)
Join these points free hand to get required curve
Here N = 100 ⇒ N/2 = 50
Two curves intersect at point P(28, 50)
Hence, the median = 28.

Question 10.
Solution:
We may prepare less than series and more than series

(i)Less than series :
RS Aggarwal Solutions Class 10 Chapter 9 Mean, Median, Mode of Grouped Data Ex 9e 18

Now on graph paper plot the points (140, 0), (144, 3), (148, 12), (152, 36), (156, 67), (160, 109), (164, 173), (168, 248), (172, 330), (176, 416), (180, 450)

(ii)More than series :
RS Aggarwal Solutions Class 10 Chapter 9 Mean, Median, Mode of Grouped Data Ex 9e 19

Now on the same graph plot the points (140, 450), (144, 447), (148, 438), (152, 414), (156, 383), (160, 341), (164, 277), (168, 202), (172, 120), (176, 34), (180, 0)
RS Aggarwal Solutions Class 10 Chapter 9 Mean, Median, Mode of Grouped Data Ex 9e 20
The curves intersect at (167, 225).
Hence, 167 is the median.

We hope the RS Aggarwal Solutions Class 10 Chapter 9 Mean, Median, Mode of Grouped Data Ex 9e help you. If you have any query regarding RS Aggarwal Solutions Class 10 Chapter 9 Mean, Median, Mode of Grouped Data Ex 9e, drop a comment below and we will get back to you at the earliest.